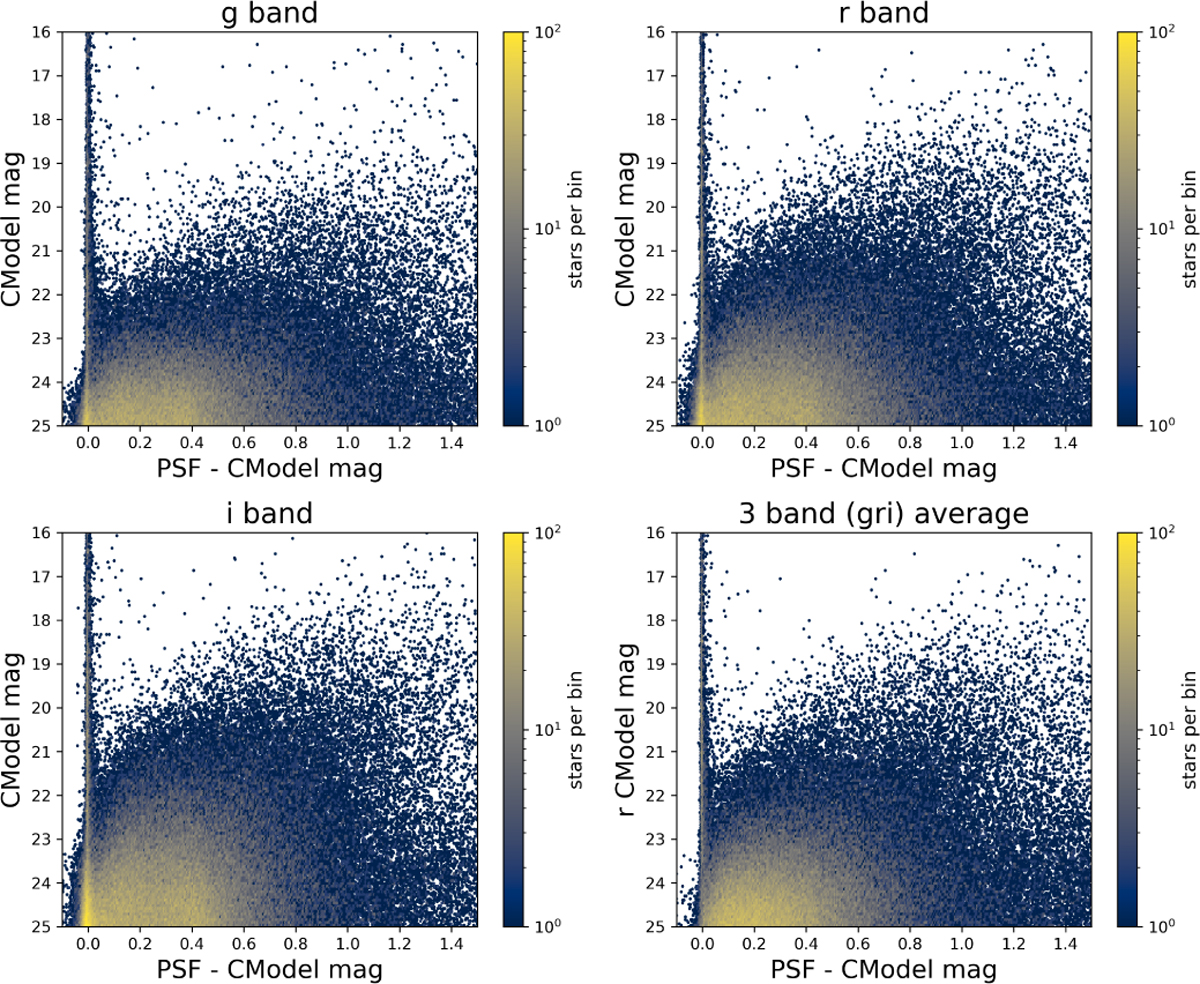
Fig. 2
Download original image
Difference between the PSF (point spread function) magnitude and the CModel magnitude in the gri bands, and the mean gri value (bottom right) vs. magnitude for the ECDFS field (analogous to Fig. 1 from Slater et al. 2020). The colormap encodes the number of stars per bin. The bimodal distribution of stars and galaxies (more precisely, unresolved and resolved sources) is evident.
Current usage metrics show cumulative count of Article Views (full-text article views including HTML views, PDF and ePub downloads, according to the available data) and Abstracts Views on Vision4Press platform.
Data correspond to usage on the plateform after 2015. The current usage metrics is available 48-96 hours after online publication and is updated daily on week days.
Initial download of the metrics may take a while.