Fig. 3
Download original image
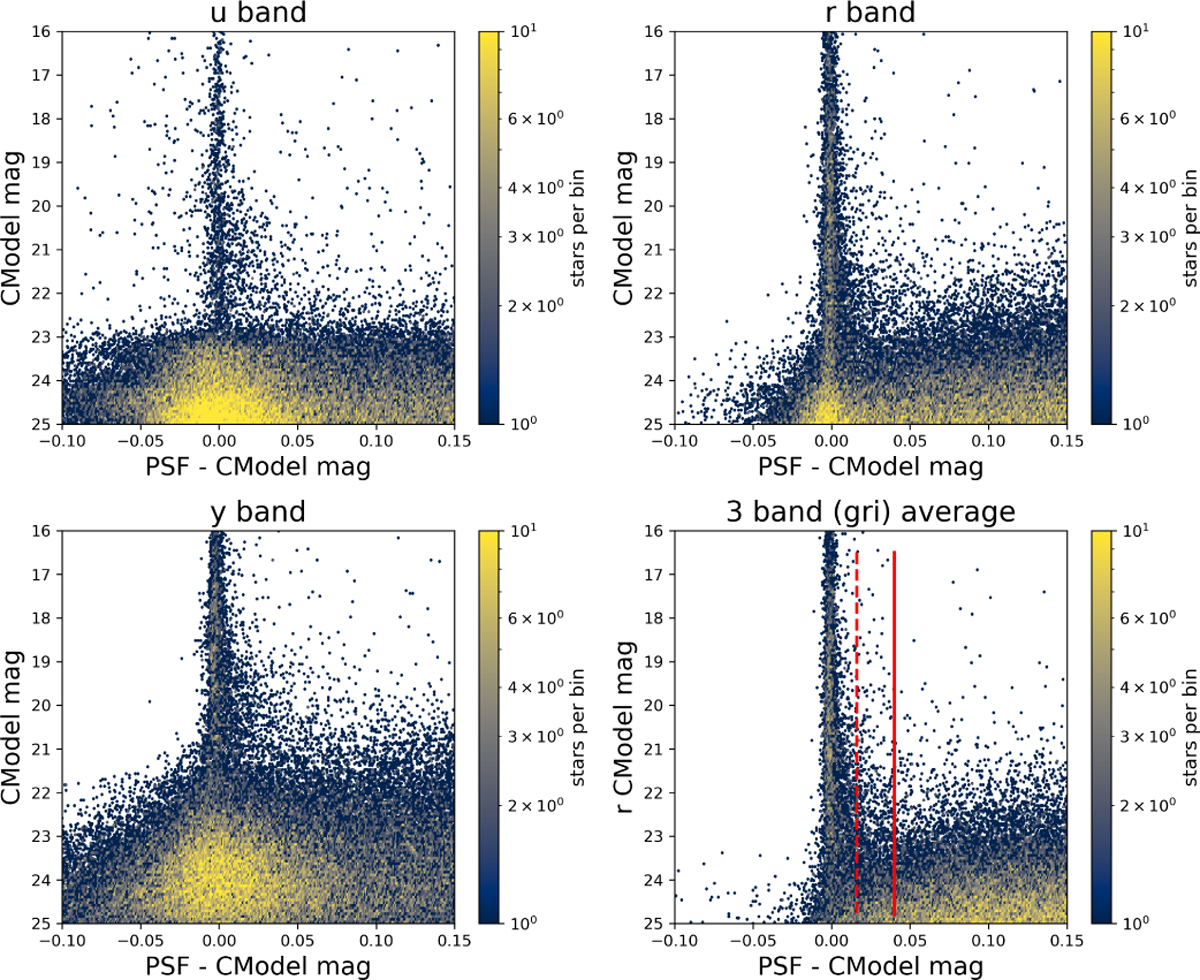
Same as Fig. 2, except that the abscissa is zoomed in on, and the left panels show the u and y band diagrams, respectively. The two vertical lines in the bottom right panel show the separation boundary between unresolved and resolved sources (dashed at 0.016 mag: Rubin default value for single-band classification; solid at 0.04 mag: adopted here for the mean gri values and designed to ensure stellar completeness to faint magnitude limits).
Current usage metrics show cumulative count of Article Views (full-text article views including HTML views, PDF and ePub downloads, according to the available data) and Abstracts Views on Vision4Press platform.
Data correspond to usage on the plateform after 2015. The current usage metrics is available 48-96 hours after online publication and is updated daily on week days.
Initial download of the metrics may take a while.