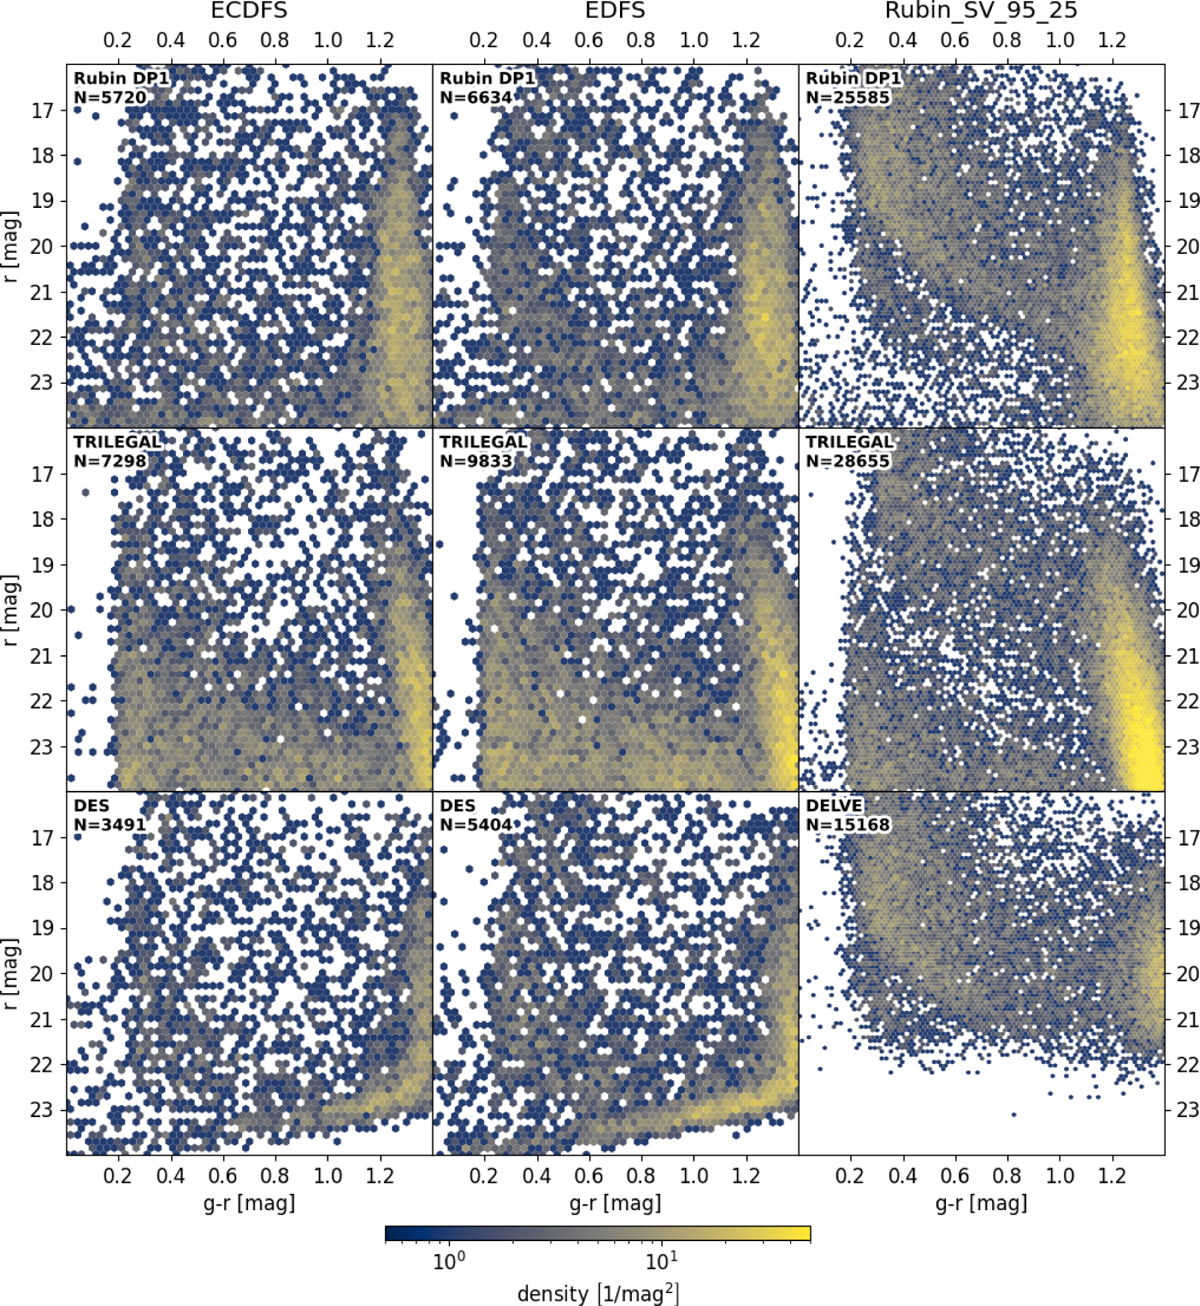
Fig. 5
Download original image
Comparison of color-magnitude diagrams of unresolved sources selected from Rubin DP1 (top row), TRILEGAL simulation (middle row), and DES and DELVE data (bottom row). Each column corresponds to one of the Rubin DP1 fields (as designated in the top left corner of each panel). The color scale follows the probability density. While bin sizes are smaller in the rightmost column, the same color scale is shared between all panels. TRILEGAL, DELVE, and DES data have been selected so that the area of each field is equal to the approximate area covered by the corresponding DP1 fields. Recall that r < 24, star-galaxy separation and 0 < g − r < 1.4 selection criteria were applied. DELVE data contain only a few stars fainter than r≈22. We call attention to the deficit of faint (r > 22) blue stars (g − r < 0.6), compared to TRILEGAL simulation, in all three fields.
Current usage metrics show cumulative count of Article Views (full-text article views including HTML views, PDF and ePub downloads, according to the available data) and Abstracts Views on Vision4Press platform.
Data correspond to usage on the plateform after 2015. The current usage metrics is available 48-96 hours after online publication and is updated daily on week days.
Initial download of the metrics may take a while.