Open Access
Fig. 6
Download original image
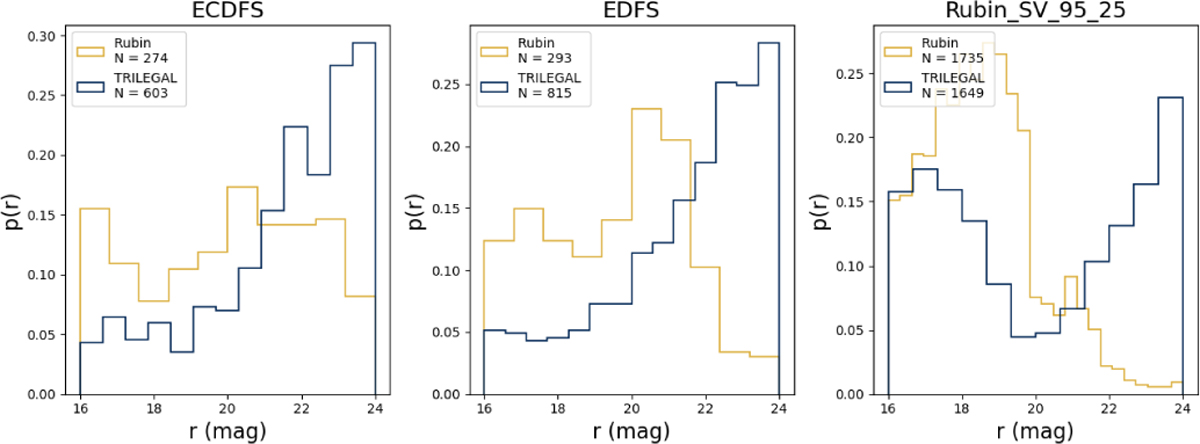
Comparison of observed counts and TRILEGAL simulation using sources with 0.3 < g − r < 0.4, separately for each of the three DP1 fields, as marked at the top of each panel. Note: the TRILEGAL simulation predicts steep rise of counts for r < 21, which is not seen in Rubin data.
Current usage metrics show cumulative count of Article Views (full-text article views including HTML views, PDF and ePub downloads, according to the available data) and Abstracts Views on Vision4Press platform.
Data correspond to usage on the plateform after 2015. The current usage metrics is available 48-96 hours after online publication and is updated daily on week days.
Initial download of the metrics may take a while.