Fig. 8
Download original image
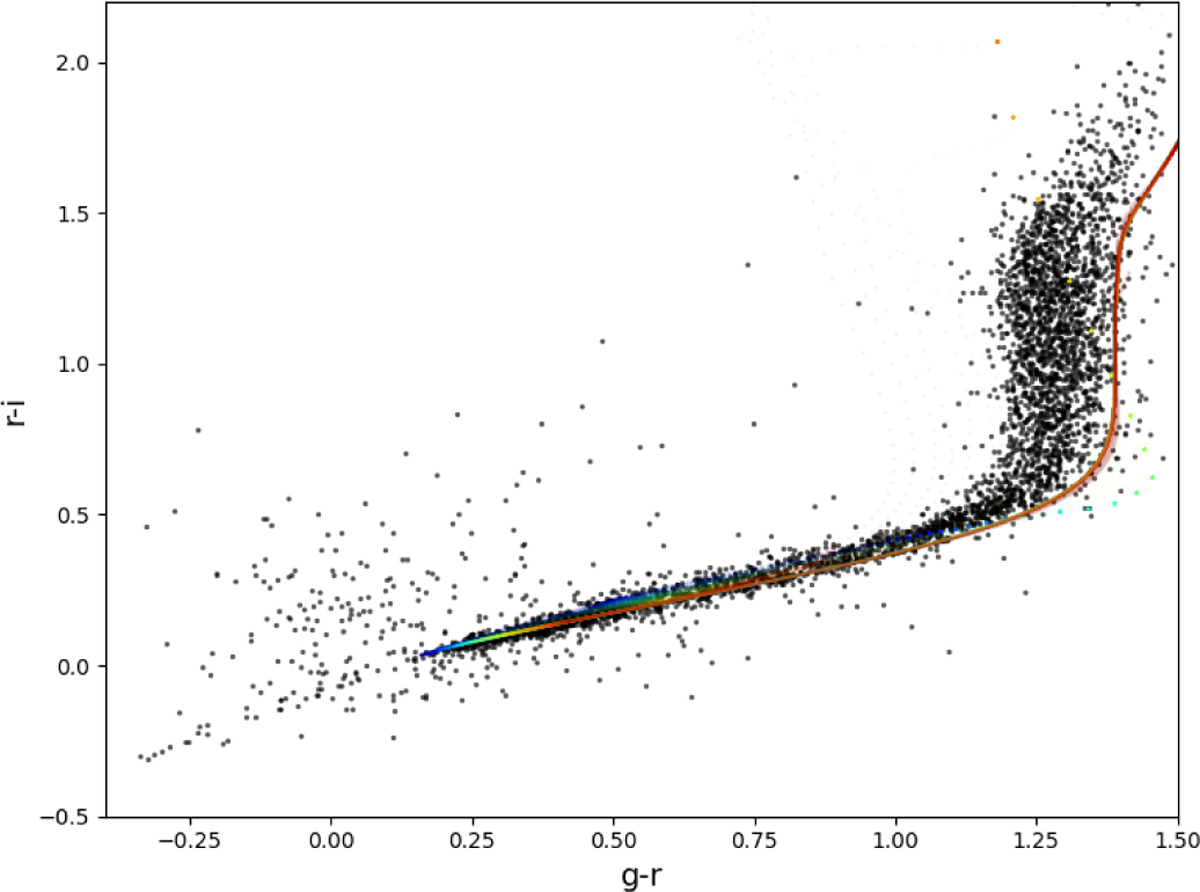
Comparison of the distribution of unresolved sources from Rubin DP1 in the r − i vs. g − r color–color diagram (symbols) and stellar model color sequences from Palaversa et al. (2025), which are in excellent agreement with SDSS observations. The sequences are color-coded by metallicity (−2.5 < [Fe/H] < +0.5, linearly from blue to red), but in this color projection they are primarily degenerate (for more details see Fig. 3 in Palaversa et al. 2025). Note: M stars with r − i > 0.5 have a mean g − r color of ~1.3, while in the SDSS photometric system, this is g − r ~ 1.4.
Current usage metrics show cumulative count of Article Views (full-text article views including HTML views, PDF and ePub downloads, according to the available data) and Abstracts Views on Vision4Press platform.
Data correspond to usage on the plateform after 2015. The current usage metrics is available 48-96 hours after online publication and is updated daily on week days.
Initial download of the metrics may take a while.