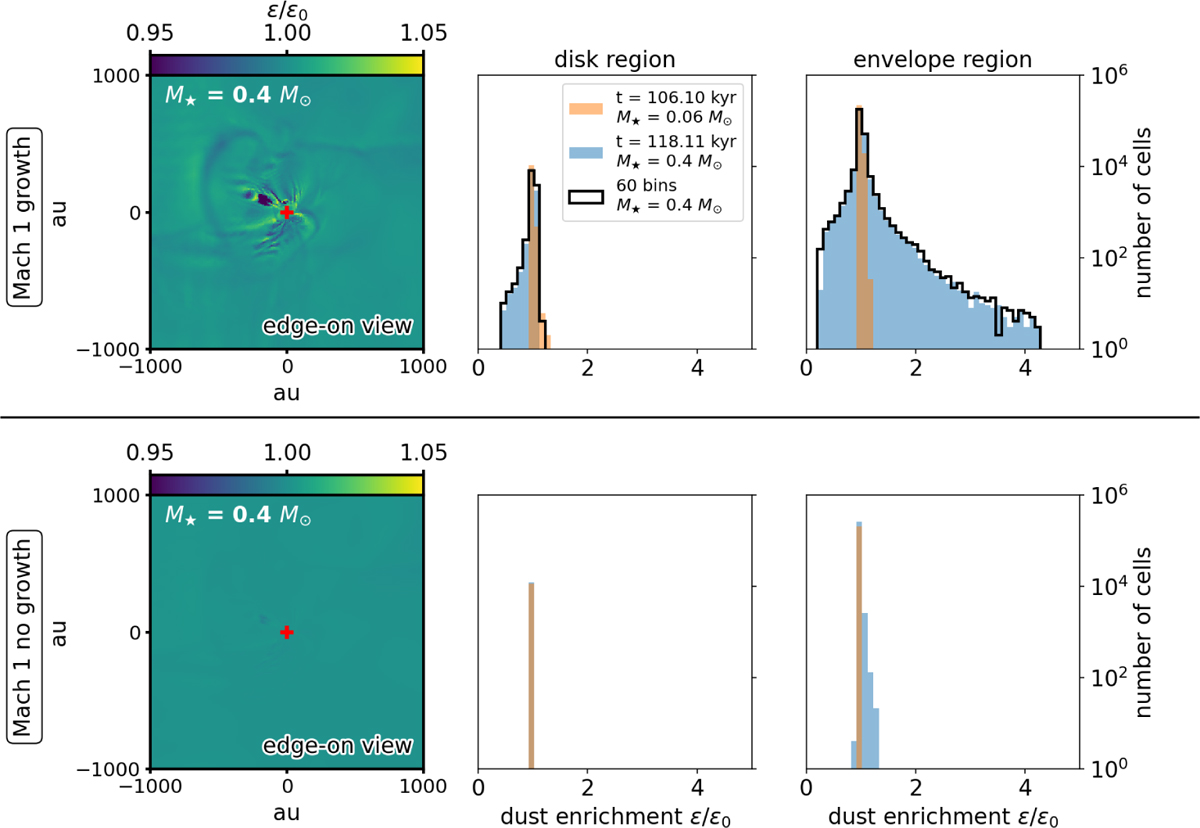
Fig. 2
Download original image
Snapshots and histograms of the dust enrichment at two given times of model ℳ1 with (top row) and without (bottom row) dust growth. The histograms are obtained with the dust enrichment calculated in each cell in a box with sides of 2000 au around the star. The two times are when M⋆ = 0.06 M⊙ (orange) and M⋆ = 0.4 M⊙ (blue). Dust growth and dynamics result in larger local variations in the dust enrichment, by a factor of greater than 2, in the envelope compared to the dust dynamics alone. The black line shows the histograms for the ℳ1 model with dust growth and 60 dust bins, highlighting the numerical convergence reached with 40-bin simulations. The red cross represents the position of the star. The variance value of ~0.01 of the histogram explains the low variation observed on the map for model ℳ1 when M⋆ = 0.4 M⊙.
Current usage metrics show cumulative count of Article Views (full-text article views including HTML views, PDF and ePub downloads, according to the available data) and Abstracts Views on Vision4Press platform.
Data correspond to usage on the plateform after 2015. The current usage metrics is available 48-96 hours after online publication and is updated daily on week days.
Initial download of the metrics may take a while.