Fig. 4
Download original image
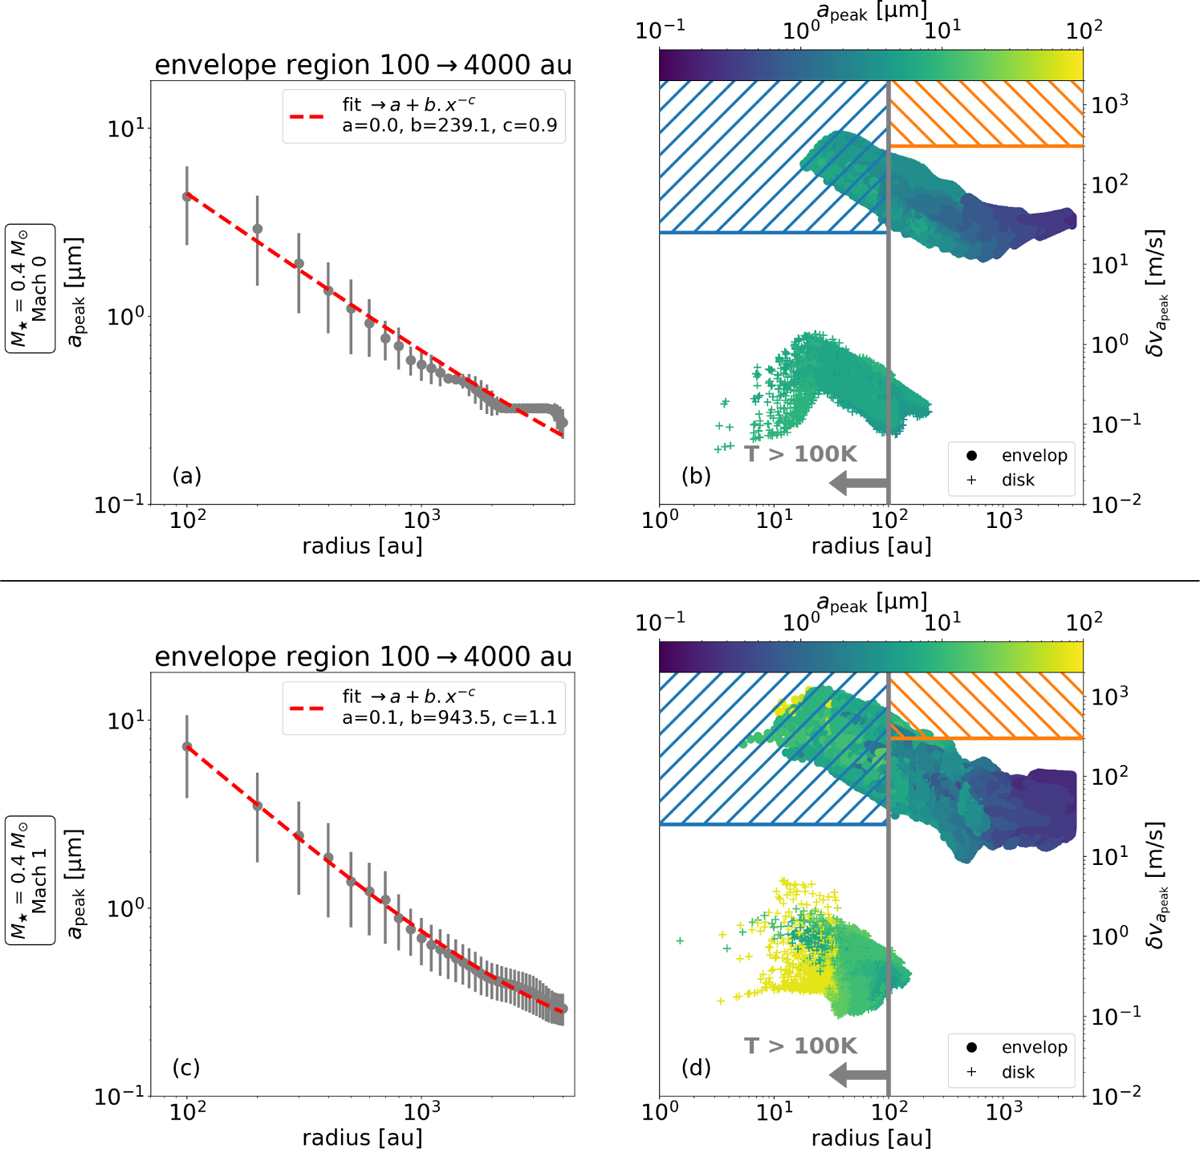
Radial profiles of the dust grain size at the peak of the size distribution, apeak (see the main text for further details) and the grain-grain differential velocity of grains with size apeak from the turbulence models (see Appendix A.1), noted δvapeak, for the two snapshots shown in Fig. 1: models ℳ0 and ℳ1 at t0.4M⊙. Left panels: Radial profiles built by computing the mean apeak in concentric shells from the apeak map (for further details, see Fig. G.1 and the text). The mean dust grain size clearly increases with decreasing envelope radius, up to ~10 μm. The power law in model ℳ1 is higher than for model ℳ0. This shows that the grains grow faster in model ℳ1 since the gas turbulence tends to slow the collapse, leaving more time for grains to grow. Right panels: Dust grain populations (color-coded by apeak) at all envelope radii, plotted against the δvapeak they experience at this envelope location (in individual cells in the model). A vertical gray line represents the 100 au radius, approximating the ice line expected for such solar-type protostars. On each side of this line, orange and blue shaded areas represent the locations where the dust grains are expected to fragment (see text for further details).
Current usage metrics show cumulative count of Article Views (full-text article views including HTML views, PDF and ePub downloads, according to the available data) and Abstracts Views on Vision4Press platform.
Data correspond to usage on the plateform after 2015. The current usage metrics is available 48-96 hours after online publication and is updated daily on week days.
Initial download of the metrics may take a while.