Fig. B.1
Download original image
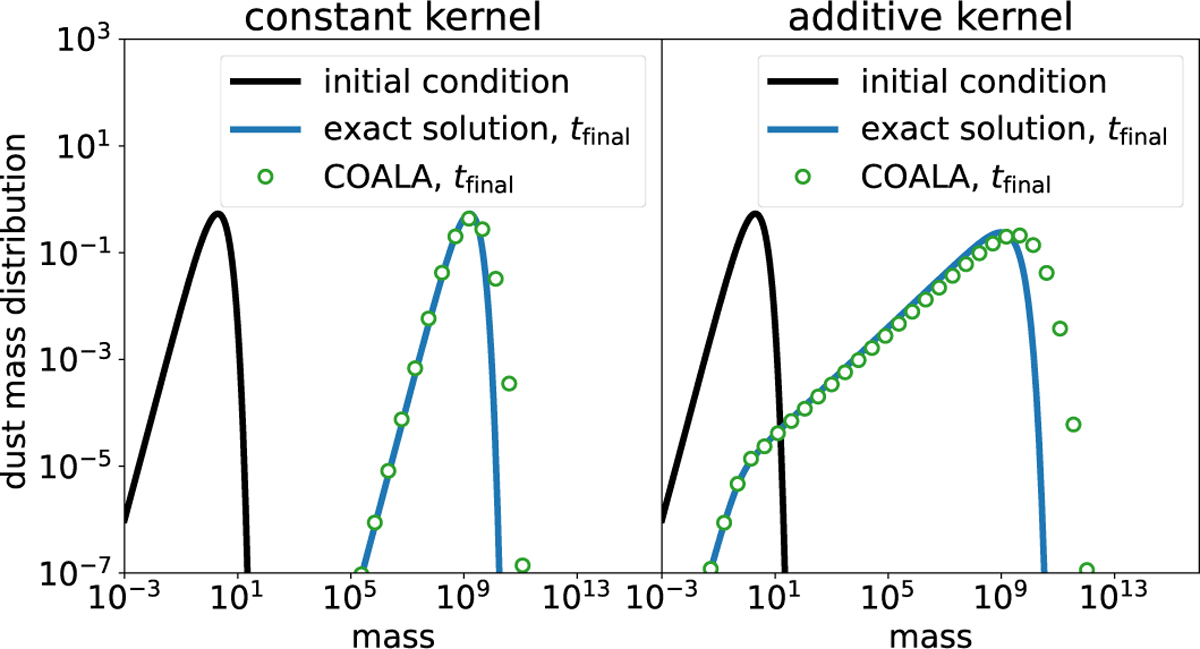
Benchmarks of the code COALA to solve the Smoluchowski coagulation equation (Eq. (1)) with the constant and the additive kernels. In the two plots, the y-axis are the dust grain mass distribution and the x-axis the grain masses in dimensionless unit. The mass range is chosen in order to have 19 orders of magnitude in mass similar to the mass range obtained from smin = 5 nm to smax = 1 nm. The black lines are the initial mass distribution. The blue lines are the exact solutions at a final time tfinal. The green circle are the numerical solutions for which the mass range is sampled in 40 mass bins. The numerical solutions follow accurately the exact solutions.
Current usage metrics show cumulative count of Article Views (full-text article views including HTML views, PDF and ePub downloads, according to the available data) and Abstracts Views on Vision4Press platform.
Data correspond to usage on the plateform after 2015. The current usage metrics is available 48-96 hours after online publication and is updated daily on week days.
Initial download of the metrics may take a while.