Open Access
Fig. C.1
Download original image
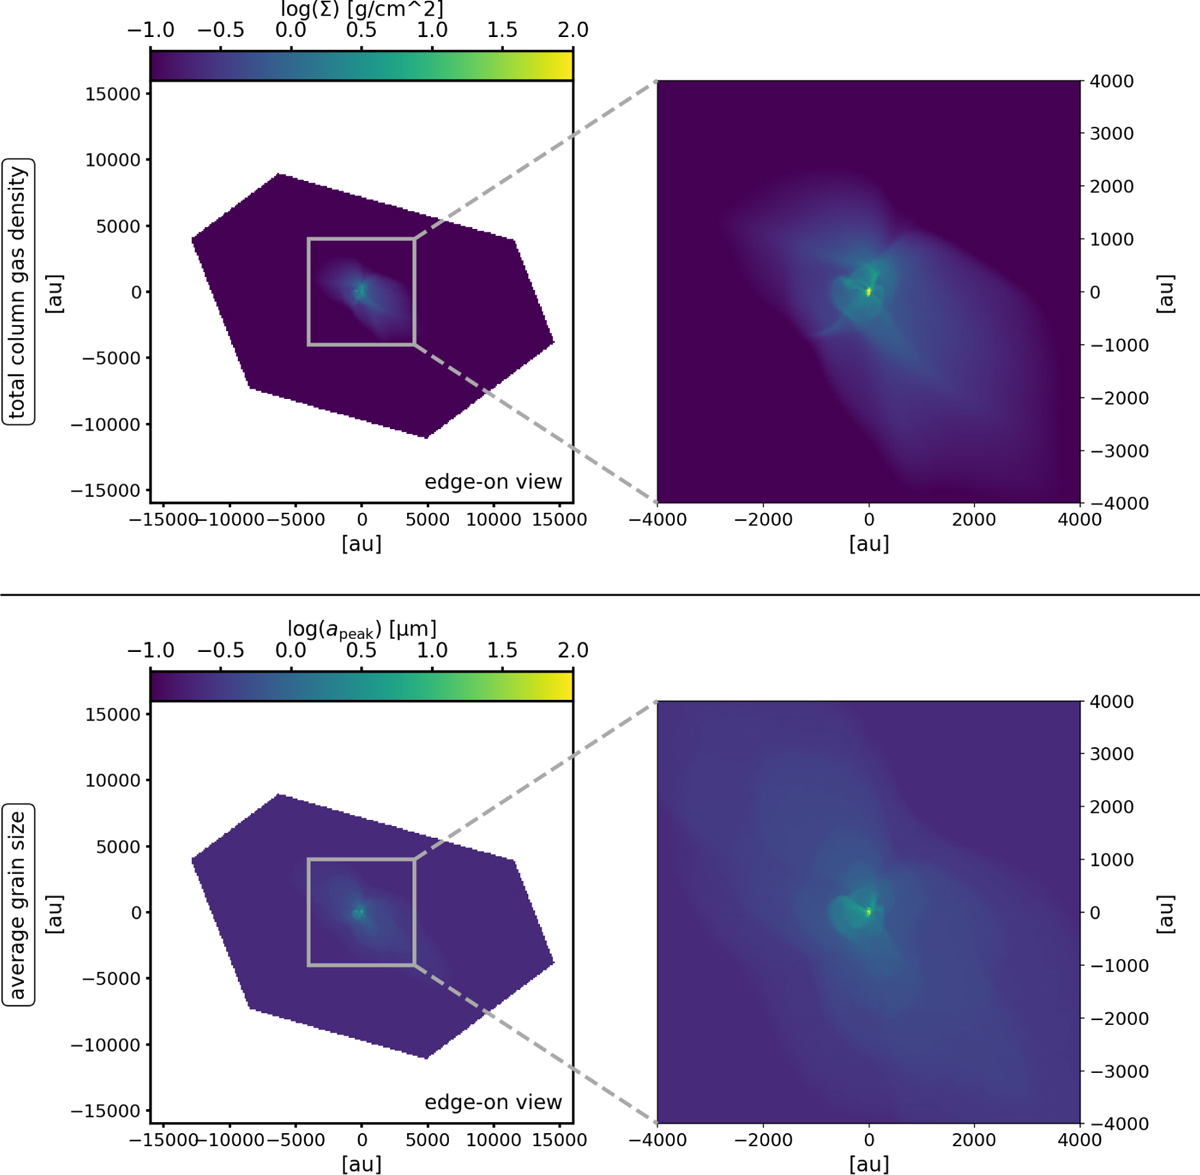
Selected cube of 8000 au sides (grey square) in the simulations of around 32000 au side to perform the analysis in Fig. 4. Upper row: Total column gas density maps. Lower row: Grain size at the peak of the dust size distribution.
Current usage metrics show cumulative count of Article Views (full-text article views including HTML views, PDF and ePub downloads, according to the available data) and Abstracts Views on Vision4Press platform.
Data correspond to usage on the plateform after 2015. The current usage metrics is available 48-96 hours after online publication and is updated daily on week days.
Initial download of the metrics may take a while.