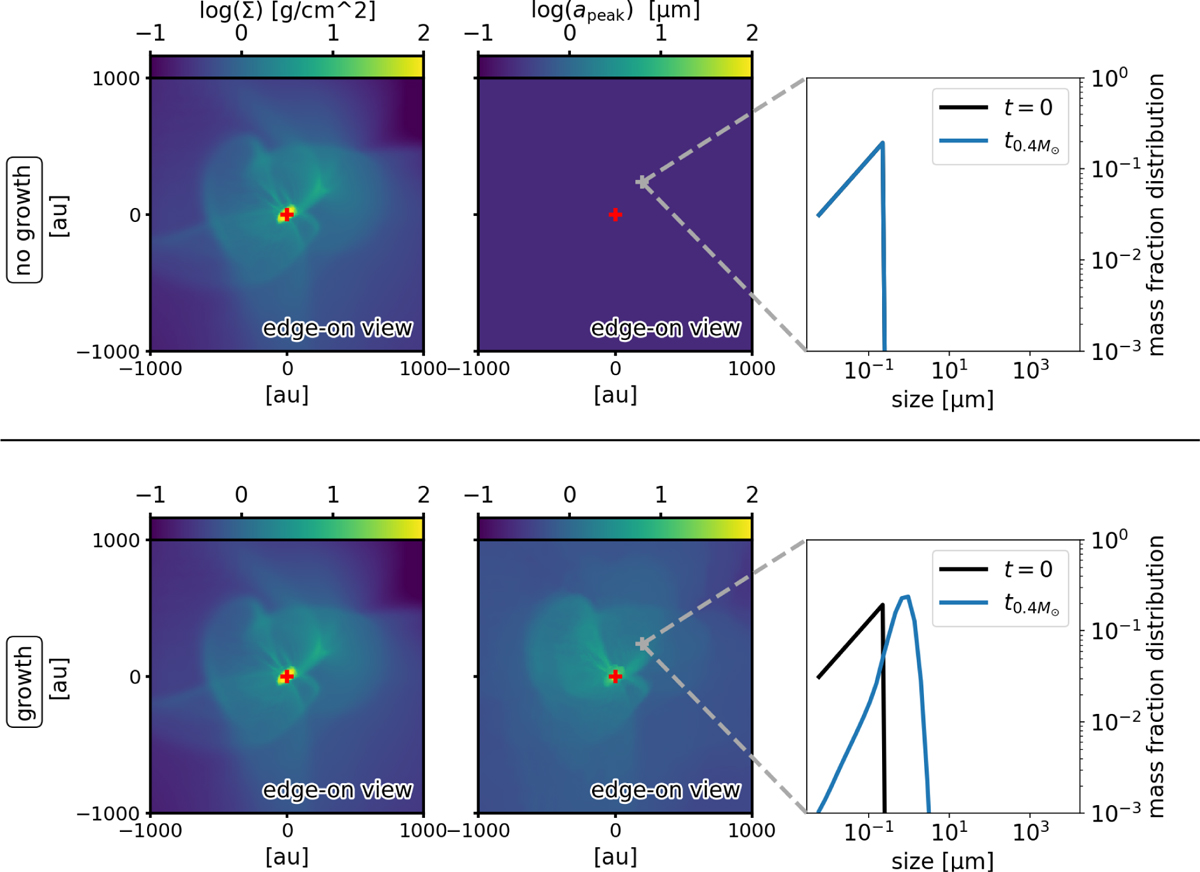
Fig. F.1
Download original image
Comparison without dust growth (upper row) and with dust growth (lower row) for the model ℳ1 with M⋆ = 0.4M⊙. The red cross gives the position of the star. The left and middle columns show the total column gas density Σ and the average grain size at the peak of the dust size distribution apeak similarly to Fig. 1. For the model without growth, the apeak is the maximum size of the MRN distribution (~250 nm). The right column shows the evolution of the dust size distribution in a cell in the simulation.
Current usage metrics show cumulative count of Article Views (full-text article views including HTML views, PDF and ePub downloads, according to the available data) and Abstracts Views on Vision4Press platform.
Data correspond to usage on the plateform after 2015. The current usage metrics is available 48-96 hours after online publication and is updated daily on week days.
Initial download of the metrics may take a while.