Fig. G.1
Download original image
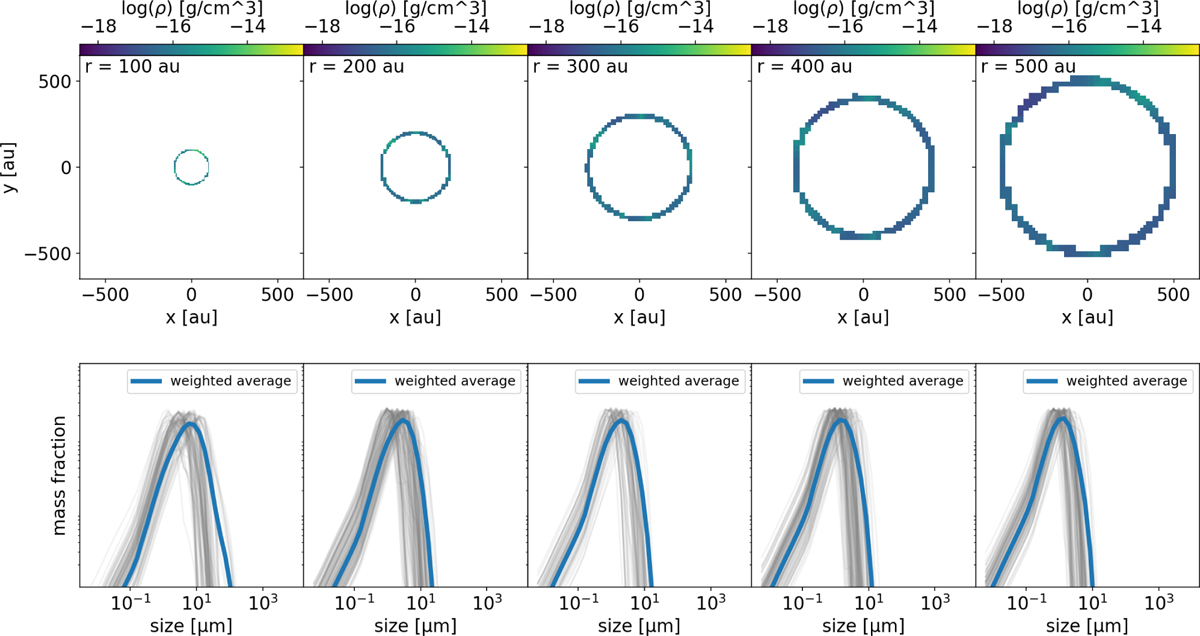
Radial dependence of the dust grain size distribution, from the model ℳ1 with M⋆ = 0.4 M⊙. Concentric shells of varying radii from 100 to 4000 au (as shown in the upper panels) are used to compute the mean dust grain size distributions shown in the lower panels. The dust grains size distribution is represented by the mass fraction distribution (see text for details). Here only the five first concentric shells with radius [100,200,300,400,500] au are shown in upper panel with the corresponding average dust grain size distribution weighted by the gas density (blue line) in the lower panel. The dust grain size distributions in each cell defining the shell are shown (light grey lines) in the lower panel.
Current usage metrics show cumulative count of Article Views (full-text article views including HTML views, PDF and ePub downloads, according to the available data) and Abstracts Views on Vision4Press platform.
Data correspond to usage on the plateform after 2015. The current usage metrics is available 48-96 hours after online publication and is updated daily on week days.
Initial download of the metrics may take a while.