Open Access
Fig. 1.
Download original image
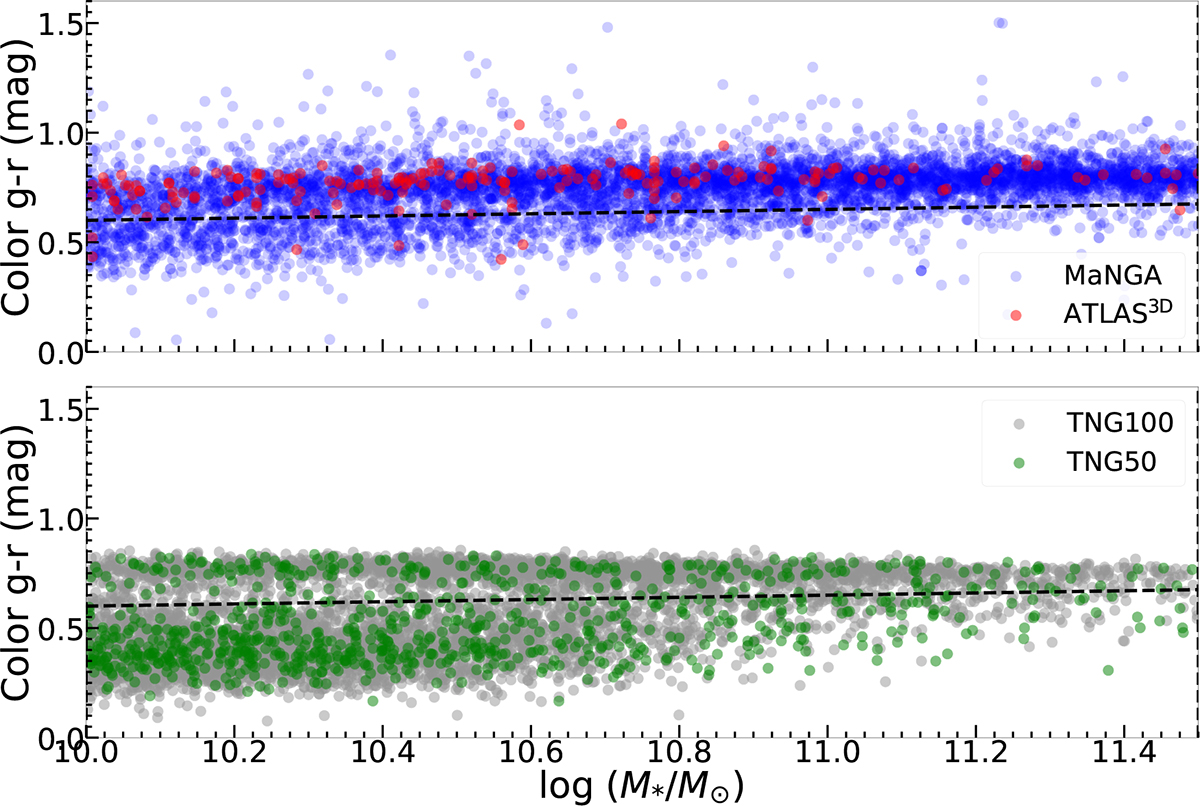
g − r color–stellar mass diagram. Top: observational data (from MaNGA and ATLAS3D). Bottom: simulated data (from TNG50 and TNG100). Both panels encompass all samples within the mass range of 1010 − 1011.5 M⊙. Red sequence ETGs are selected above the dashed line.
Current usage metrics show cumulative count of Article Views (full-text article views including HTML views, PDF and ePub downloads, according to the available data) and Abstracts Views on Vision4Press platform.
Data correspond to usage on the plateform after 2015. The current usage metrics is available 48-96 hours after online publication and is updated daily on week days.
Initial download of the metrics may take a while.