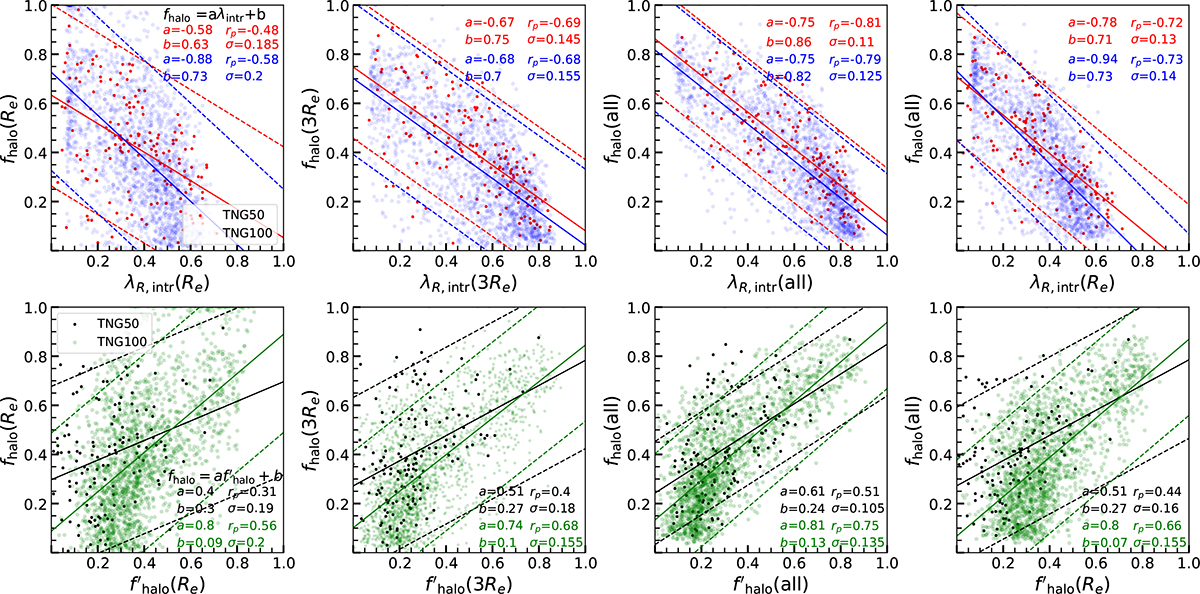
Fig. 11.
Download original image
Correlations of λR, intr versus fhalo and f′halo versus fhalo. Top row: Relationships between λR, intr and fhalo measured within Re (first column), 3Re (second column), and for all stars (third column). Fourth column: Relation between λR, intr(Re) and fhalo(all). The solid red and blue lines, along with their corresponding dashed lines, represent the linear fits and 2σ confidence interval for the TNG50 and TNG100 datasets, respectively. Fit coefficients, σ values, and Pearson correlation coefficients (rp) are provided in the top-right corner of each panel. Second row: Similar layout, but illustrating the relationship between f′halo and fhalo. Here, the solid black and green lines, with accompanying dashed lines, indicate the linear fits and 2σ confidence interval for the TNG50 and TNG100 datasets, respectively.
Current usage metrics show cumulative count of Article Views (full-text article views including HTML views, PDF and ePub downloads, according to the available data) and Abstracts Views on Vision4Press platform.
Data correspond to usage on the plateform after 2015. The current usage metrics is available 48-96 hours after online publication and is updated daily on week days.
Initial download of the metrics may take a while.