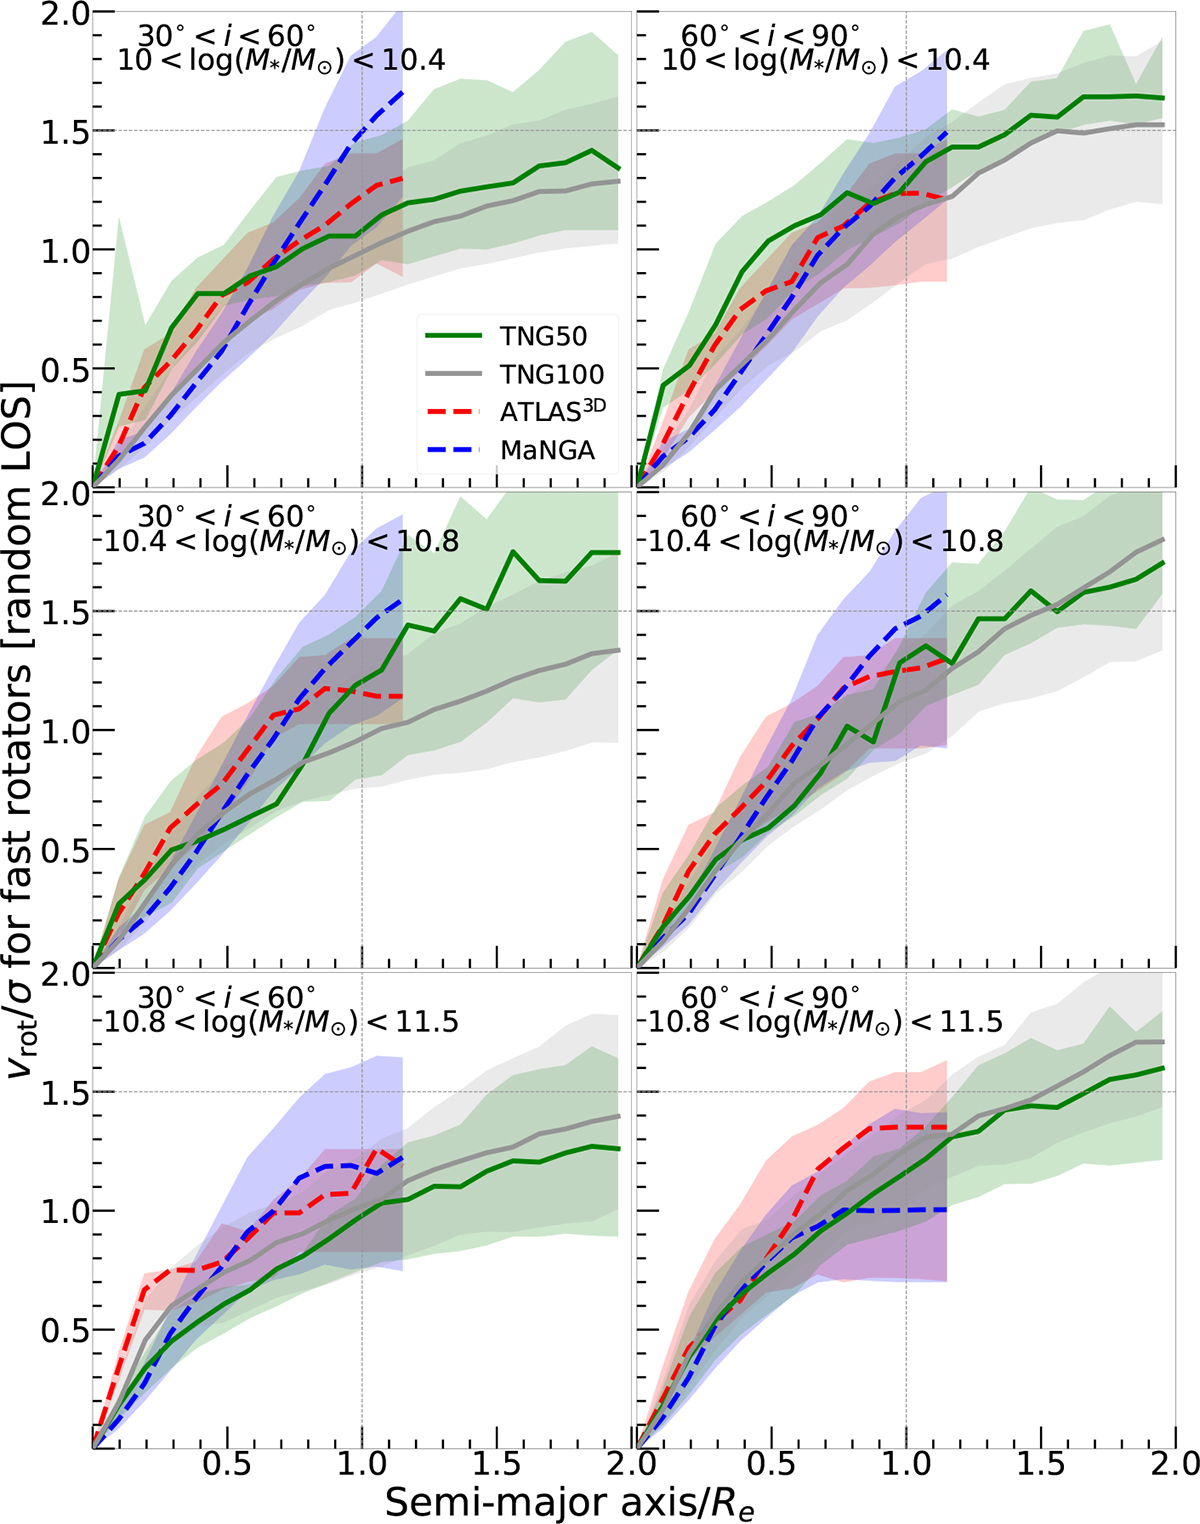
Fig. 12.
Download original image
Median Vrot/σ profiles for FRs selected using our new threshold (κrot(all) > 0.5), projected along a random LOS. Top row: Galaxy samples that fall within mass ranges [1010.0, 1010.4] M⊙, with galaxy samples presented at different inclinations: 30° −60° and 60° −90°, respectively, from left to right. The solid green lines, solid gray lines, dashed red lines, and dashed blue lines, along with their corresponding shaded regions in the figure, represent the data from TNG50, TNG100, ATLAS3D, and MaNGA, respectively. The datasets from the simulation and the observation showcase median profiles, with shaded regions indicating the 16th and 84th percentiles of the distribution. Vertical and horizontal dashed lines are included as visual aids for comparing simulations and observations. The profiles of the simulated ETG FRs closely resemble those observed. Middle and bottom rows: same as the top row, but with galaxy samples that fall within mass ranges [1010.4, 1010.8] M⊙ and [1010.8, 1011.5] M⊙.
Current usage metrics show cumulative count of Article Views (full-text article views including HTML views, PDF and ePub downloads, according to the available data) and Abstracts Views on Vision4Press platform.
Data correspond to usage on the plateform after 2015. The current usage metrics is available 48-96 hours after online publication and is updated daily on week days.
Initial download of the metrics may take a while.