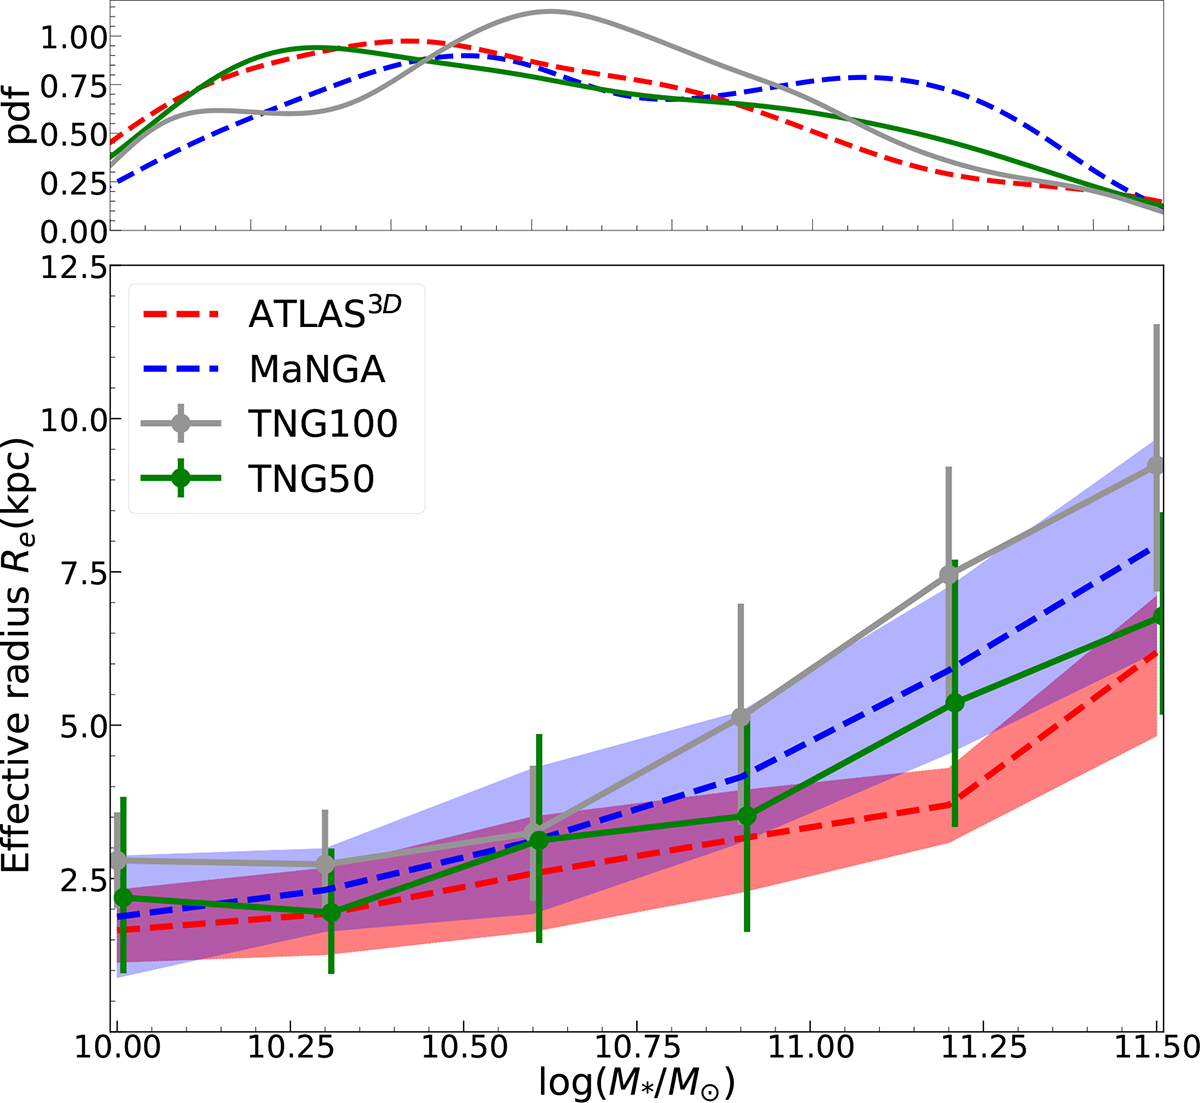
Fig. 2.
Download original image
Mass–size relation. Top: stellar mass distribution function of the chosen sample of ETGs from observational data and the TNG simulations. Bottom: Circularized effective radii Re, of the selected ETG samples in the TNG100 and TNG50 simulations as a function of stellar mass and compared with observations (ATLAS3D and MaNGA). Both TNG50 (solid green line) and TNG100 (solid gray line) galaxies share comparable stellar masses and sizes with the ATLAS3D (dashed red line) and MaNGA (dashed blue line) galaxies. The lines and points represent the median values, with colored regions and error bars indicating the 16th to 84th percentile range of each distribution. To avoid overlap, we shift the error bars slightly for clarity.
Current usage metrics show cumulative count of Article Views (full-text article views including HTML views, PDF and ePub downloads, according to the available data) and Abstracts Views on Vision4Press platform.
Data correspond to usage on the plateform after 2015. The current usage metrics is available 48-96 hours after online publication and is updated daily on week days.
Initial download of the metrics may take a while.