Fig. 3.
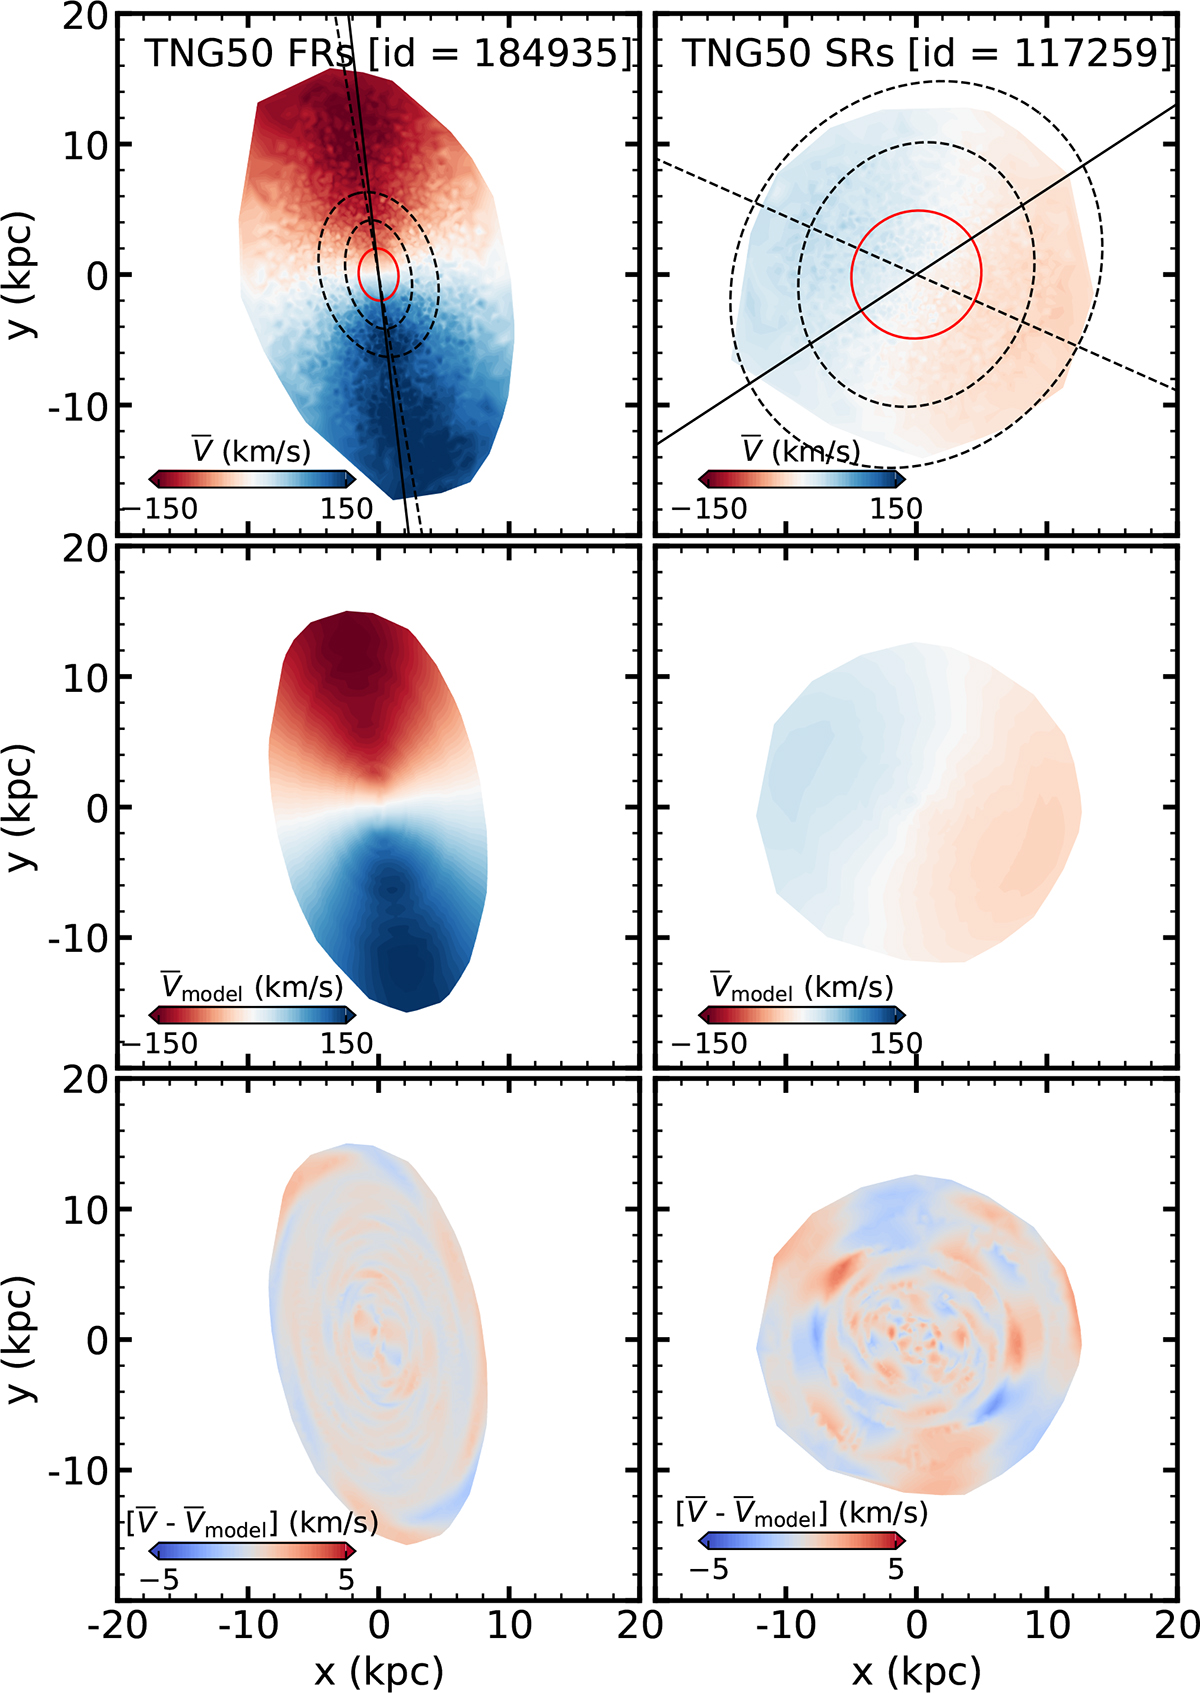
Download original image
Velocity maps and models of examples of a FR (left) and a SR (right), with raw data (top), a reconstructed velocity field employing a pure cosine law along ellipses (middle), and residuals depicting deviations (bottom). Our visualization emphasizes structural features through isodensity ellipses spaced at regular Re intervals from Re to 3Re. The major axis orientations – with solid lines representing photometrically derived morphological axes and dashed lines indicating kinematically determined axes – are both measured at Re.
Current usage metrics show cumulative count of Article Views (full-text article views including HTML views, PDF and ePub downloads, according to the available data) and Abstracts Views on Vision4Press platform.
Data correspond to usage on the plateform after 2015. The current usage metrics is available 48-96 hours after online publication and is updated daily on week days.
Initial download of the metrics may take a while.