Fig. 4.
Download original image
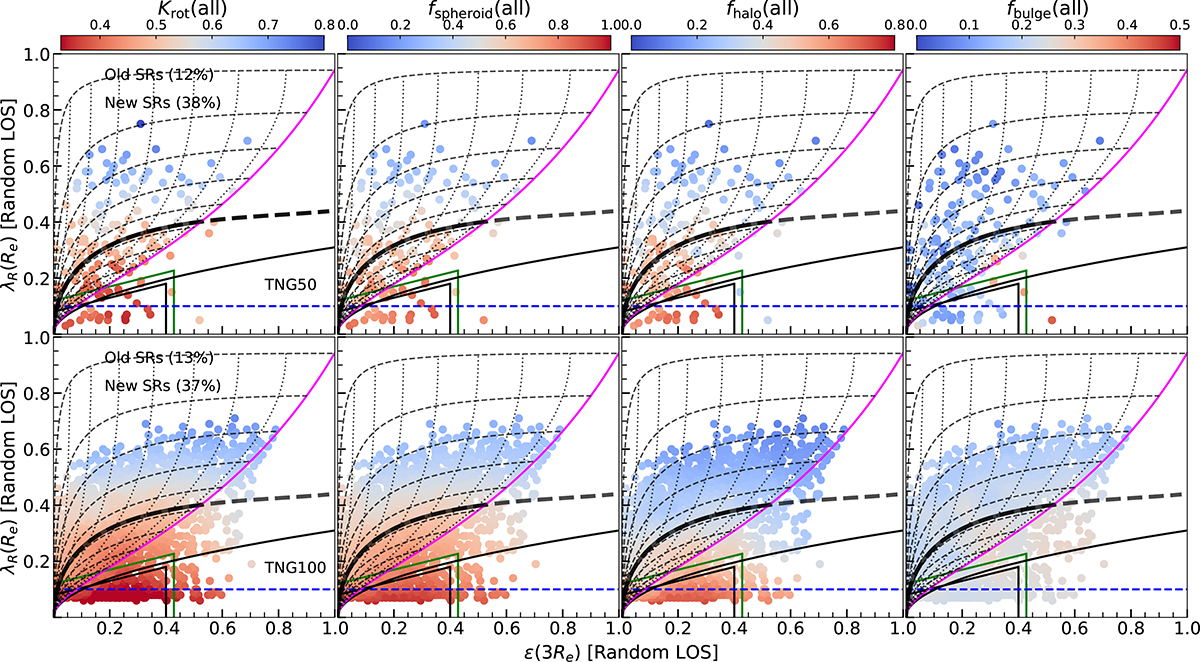
λR(Re)−ε(3Re) diagram color-coded by κrot(all), fspheroid(all), fhalo(all), and fbulge(all) for TNG50 (upper) and TNG100 (lower). Here, κrot(all), fspheroid(all), fhalo(all), and fbulge(all) represent the significance of cylindrical rotation, the spheroidal mass fraction, the stellar halo mass fraction, and the bulge mass fraction, respectively (see Sections 4.3 and 4.4). The magenta curve shows the λR − ε relation for edge-on, axisymmetric galaxies derived by Cappellari et al. (2007). The dotted black curves illustrate this relation across varying i, with steps of Δi = 10°. Additionally, the thin dashed black lines represent the theoretical distribution for the different rotations spaced at intervals of ΔλR, intr = 0.1. The bold black curve represents our proposed new threshold for distinguishing between SRs and FRs. This threshold is derived from the tensor virial theorem for oblate galaxies with intrinsic parameters λR, intr(Re) = 0.4 and εintr = 0.525, assuming an anisotropy of δ = 0.7εintr = 0.367. For comparison, the thin solid black line represents the standard empirical threshold defined by ![]() proposed in Emsellem et al. (2011, Eq. (3)). We present the proportion of SRs classified by our new threshold alongside the standard old threshold at the upper-left corner. We smoothed the color data using the locally weighted regression method LOESS (Cleveland & Devlin 1988; Cappellari et al. 2013a) with a smoothing factor of 0.1. The horizontal dashed blue line represents the empirical threshold defined by λR(Re) = 0.1 according to Emsellem et al. (2007); the black polygon denotes the empirical threshold set by λR(Re) < 0.08 + ε/4 and ε < 0.4 as per Cappellari (2016); and the green polygon signifies the empirical threshold given by
proposed in Emsellem et al. (2011, Eq. (3)). We present the proportion of SRs classified by our new threshold alongside the standard old threshold at the upper-left corner. We smoothed the color data using the locally weighted regression method LOESS (Cleveland & Devlin 1988; Cappellari et al. 2013a) with a smoothing factor of 0.1. The horizontal dashed blue line represents the empirical threshold defined by λR(Re) = 0.1 according to Emsellem et al. (2007); the black polygon denotes the empirical threshold set by λR(Re) < 0.08 + ε/4 and ε < 0.4 as per Cappellari (2016); and the green polygon signifies the empirical threshold given by ![]() (with λRstart = 0.12 when the IFS data quality is comparable to that of SAMI) based on van de Sande et al. (2021).
(with λRstart = 0.12 when the IFS data quality is comparable to that of SAMI) based on van de Sande et al. (2021).
Current usage metrics show cumulative count of Article Views (full-text article views including HTML views, PDF and ePub downloads, according to the available data) and Abstracts Views on Vision4Press platform.
Data correspond to usage on the plateform after 2015. The current usage metrics is available 48-96 hours after online publication and is updated daily on week days.
Initial download of the metrics may take a while.