Open Access
Fig. 5.
Download original image
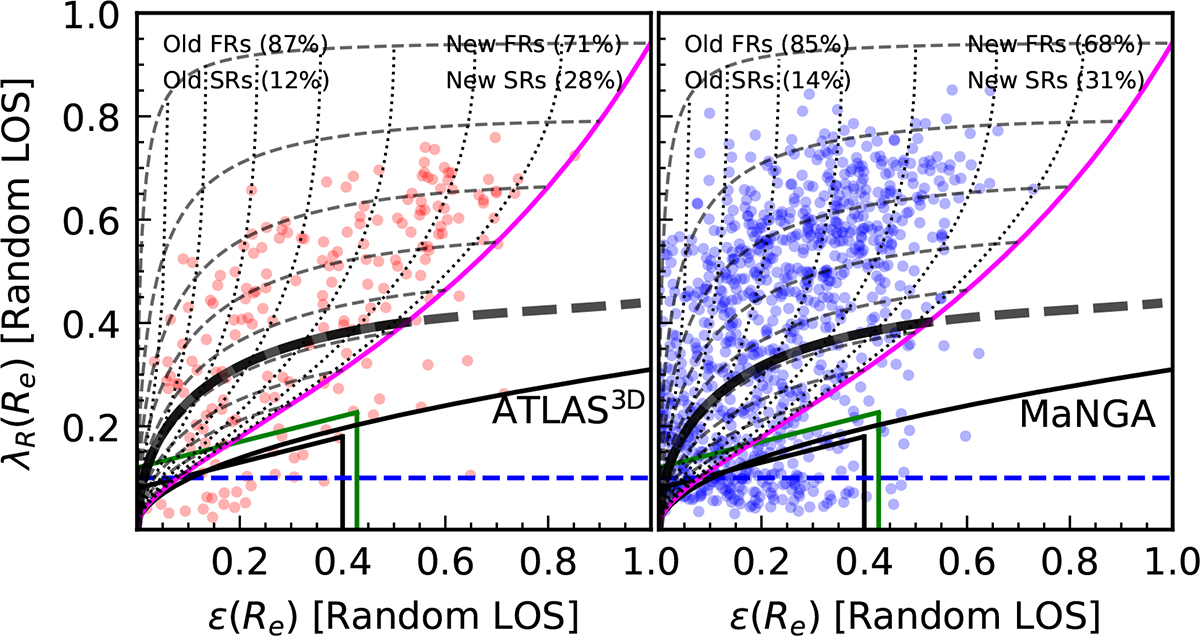
λR(Re)−ε(Re) diagram of the ATLAS3D(left panel) and MaNGA (right panel) samples. The proportions of SRs and FRs classified using our new threshold, compared to the standard old definition, are provided at the top. The definitions of all the lines are the same as those in Figure 4.
Current usage metrics show cumulative count of Article Views (full-text article views including HTML views, PDF and ePub downloads, according to the available data) and Abstracts Views on Vision4Press platform.
Data correspond to usage on the plateform after 2015. The current usage metrics is available 48-96 hours after online publication and is updated daily on week days.
Initial download of the metrics may take a while.