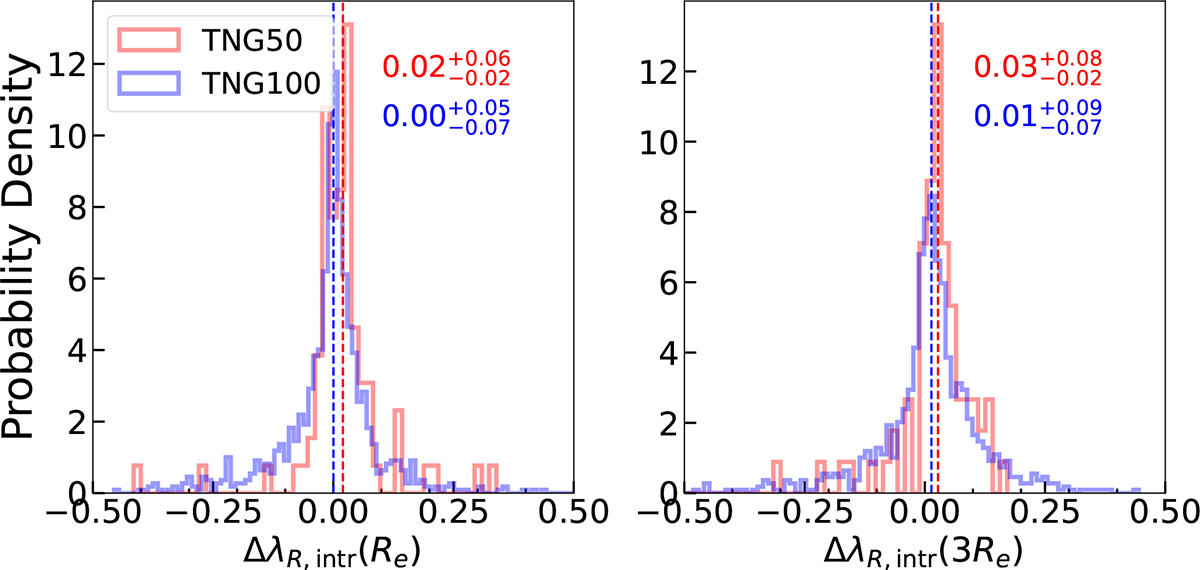
Fig. 7.
Download original image
Distribution of the deviation ΔλR, intr within different regions between the intrinsic spin parameter and its edge-on projection. Left panel: Distribution of the deviation ΔλR, intr(Re). Right panel: Distribution of the deviation ΔλR, intr(3Re). The red histogram signifies the galaxy sample derived from TNG50, whereas the blue histogram represents the galaxy sample from TNG100. The vertical dashed lines show the median of the intrinsic spin spectroscopic parameter estimation error. The median and the 16th and 84th percentiles are listed at the top right of each subplot.
Current usage metrics show cumulative count of Article Views (full-text article views including HTML views, PDF and ePub downloads, according to the available data) and Abstracts Views on Vision4Press platform.
Data correspond to usage on the plateform after 2015. The current usage metrics is available 48-96 hours after online publication and is updated daily on week days.
Initial download of the metrics may take a while.