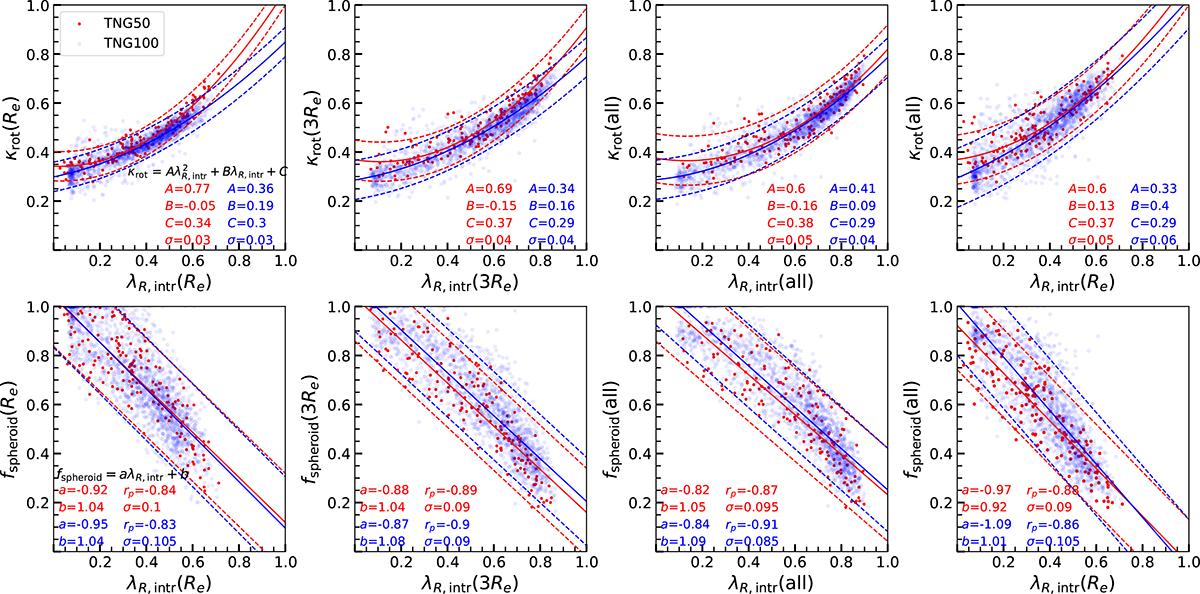
Fig. 8.
Download original image
Distribution and correlation of κrot vs. λR, intr (upper) and fspheroid vs. λR, intr (lower) measured within different regions from left to right. The solid red and blue curves show the best-fit results for the TNG50 and TNG100 datasets, respectively, while the dashed curves represent their 2σ confidence interval. The corresponding fitting coefficients and σ values are listed in the bottom-right corner of each panel. In the lower panels, we additionally provide the Pearson correlation coefficient (rp). The rp ∼ −1 value indicates a strong anticorrelation between λR, intr and fspheroid.
Current usage metrics show cumulative count of Article Views (full-text article views including HTML views, PDF and ePub downloads, according to the available data) and Abstracts Views on Vision4Press platform.
Data correspond to usage on the plateform after 2015. The current usage metrics is available 48-96 hours after online publication and is updated daily on week days.
Initial download of the metrics may take a while.