Open Access
Fig. 1.
Download original image
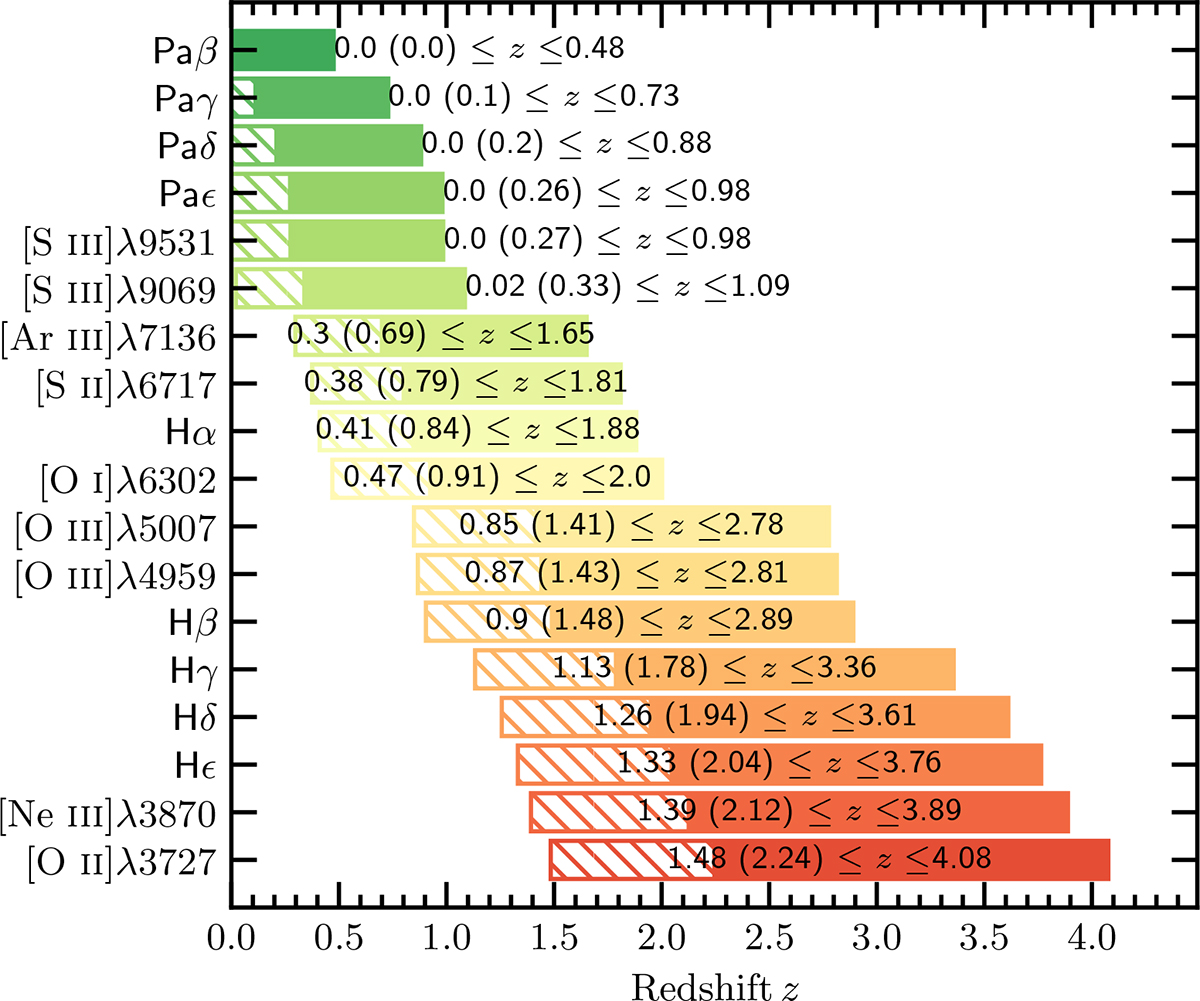
Redshift coverage of prominent emission lines in the EWS and EDS spectra. For each emission line, the full coloured bar represents the redshift range where the line is detectable in the RGS for the EWS, whilst the dashed bar indicates the extended redshift coverage provided by the BGS in the EDS.
Current usage metrics show cumulative count of Article Views (full-text article views including HTML views, PDF and ePub downloads, according to the available data) and Abstracts Views on Vision4Press platform.
Data correspond to usage on the plateform after 2015. The current usage metrics is available 48-96 hours after online publication and is updated daily on week days.
Initial download of the metrics may take a while.