Fig. 10.
Download original image
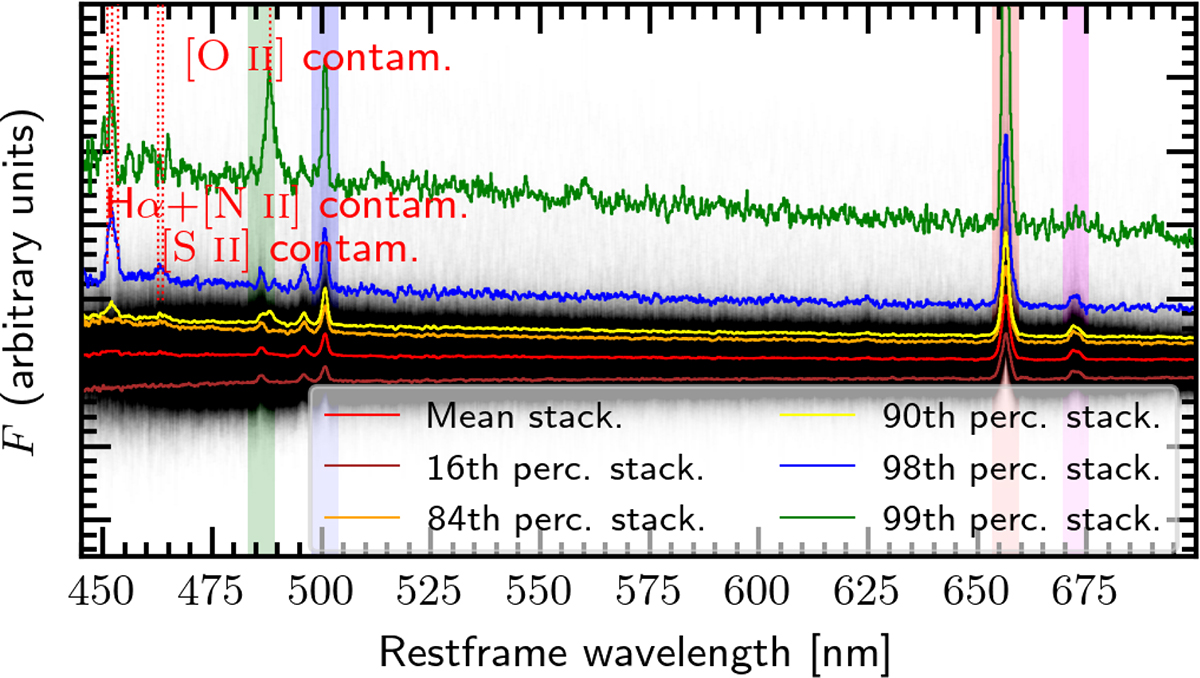
Stacked mean spectrum of simulated MAMBO galaxies from the EWS with stellar masses in the range 1010 M⊙ ≤ M* ≤ 1010.5 M⊙ and redshifts 1.52 ≤ z ≤ 1.86. The stacked is composed of a mixture of 2642 spectra, with contributions from galaxies with accurate redshifts (51%), as well as redshift contaminants arising from noise spikes (36%), [S III]λ9531 misclassified as Hα (8%), and [O III] misclassified as Hα (2%), plus minor contributions from other misclassified emission lines (∼5% in total). The plot includes the mean spectrum (red) and composite spectra at the 16th, 84th, 90th, 98th, and 99th percentiles (brown, orange, yellow, blue, and green, respectively). The contribution of individual galaxy spectra is shown in black.
Current usage metrics show cumulative count of Article Views (full-text article views including HTML views, PDF and ePub downloads, according to the available data) and Abstracts Views on Vision4Press platform.
Data correspond to usage on the plateform after 2015. The current usage metrics is available 48-96 hours after online publication and is updated daily on week days.
Initial download of the metrics may take a while.