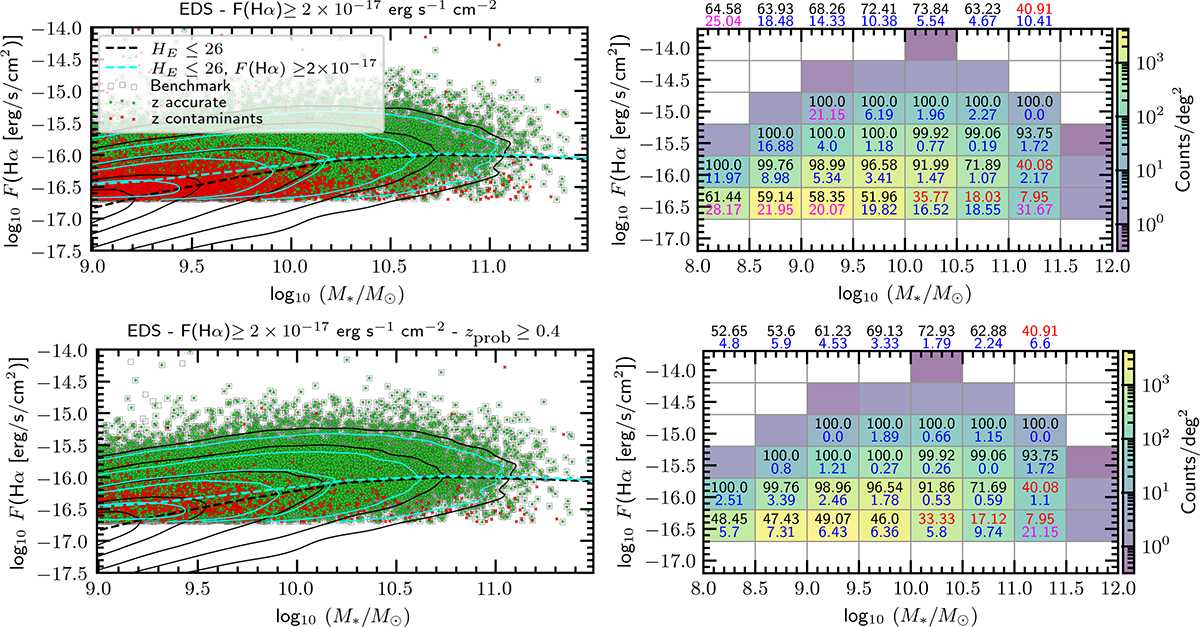
Fig. 11.
Download original image
Simulated Hα emission line as a function of stellar mass for the EDS-SFsim selection is shown for the lowest redshift range: 0.9 ≤ zmeas ≤ 1.2. Top panels present the relation at the flux limit of F(Hα)≥2 × 10⁻¹⁷ erg s−1 cm−2 and with no cut in zprob, whilst the bottom panels present the improvement obtained with our fiducial selection that also includes a cut in redshift probability zprob ≥ 0.4. The left panels show the distributions of the different subsamples: the ℬℳ sample (grey points; Eq. (7)), the observationally selected galaxies with accurate redshifts (green points), and the redshift contaminants (red points). Note that the green and red points together constitute the observationally selected sample, as defined by the denominator of Eq. (6). Black and cyan contours and dashed lines show the ground-truth distributions for the full EDS parent sample (HE ≤ 26) and a subsample selected with F(Hα)≥2 × 10⁻¹⁷ erg s−1 cm−2, respectively. These contours serve as a reference to illustrate the intrinsic (ground-truth) distributions, allowing for a qualitative comparison with the observation-like measurements, and to highlight the intrinsic selection bias introduced by the flux limit, which would persist even without redshift measurement errors. The right panels show galaxy number densities per deg2 in bins of stellar mass and Hα flux, with 𝒮ℛ (top number) and 𝒞 (bottom number) indicated. Numbers are colour-coded: black-blue for reliable bins (𝒮ℛ > 45%, 𝒞 < 20%) and red and magenta for others. The numbers reported above each mass bin represent the 𝒮ℛ (top number) and 𝒞 (bottom number) for the entire mass bin.
Current usage metrics show cumulative count of Article Views (full-text article views including HTML views, PDF and ePub downloads, according to the available data) and Abstracts Views on Vision4Press platform.
Data correspond to usage on the plateform after 2015. The current usage metrics is available 48-96 hours after online publication and is updated daily on week days.
Initial download of the metrics may take a while.