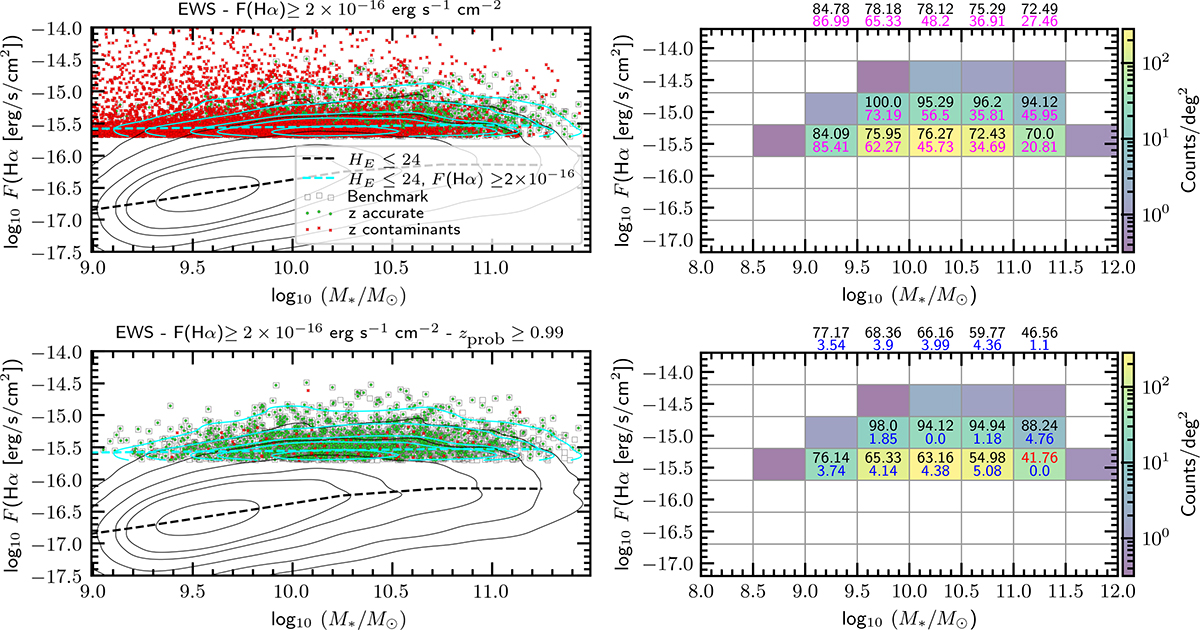
Fig. 12.
Download original image
Simulated Hα emission line as a function of stellar mass for the EWS-SFsim selection. Top panels present the relation at the flux limit of F(Hα)≥2 × 10⁻¹⁶ erg s−1 cm−2 and with no cut in zprob, whilst the bottom panels present the improvement obtained with our fiducial selection that also includes also a cut in redshift probability zprob ≥ 0.99. The layout is the same as in Fig. 11, the only difference is that the black and cyan contours and dashed lines show the ground-truth distributions for the full EWS parent sample (HE ≤ 24) and a subsample selected with F(Hα) ≥ 2 × 10⁻¹⁶ erg s−1 cm−2, respectively. Note: in this case, the bias between the cut in magnitude only and the cut in magnitude and flux limit is larger than the EDS-SFsim one. Therefore, even with stacking, we are mapping scaling relations of galaxies with Hα flux above 2 × 10⁻¹⁶ erg s−1 cm−2.
Current usage metrics show cumulative count of Article Views (full-text article views including HTML views, PDF and ePub downloads, according to the available data) and Abstracts Views on Vision4Press platform.
Data correspond to usage on the plateform after 2015. The current usage metrics is available 48-96 hours after online publication and is updated daily on week days.
Initial download of the metrics may take a while.