Fig. 13.
Download original image
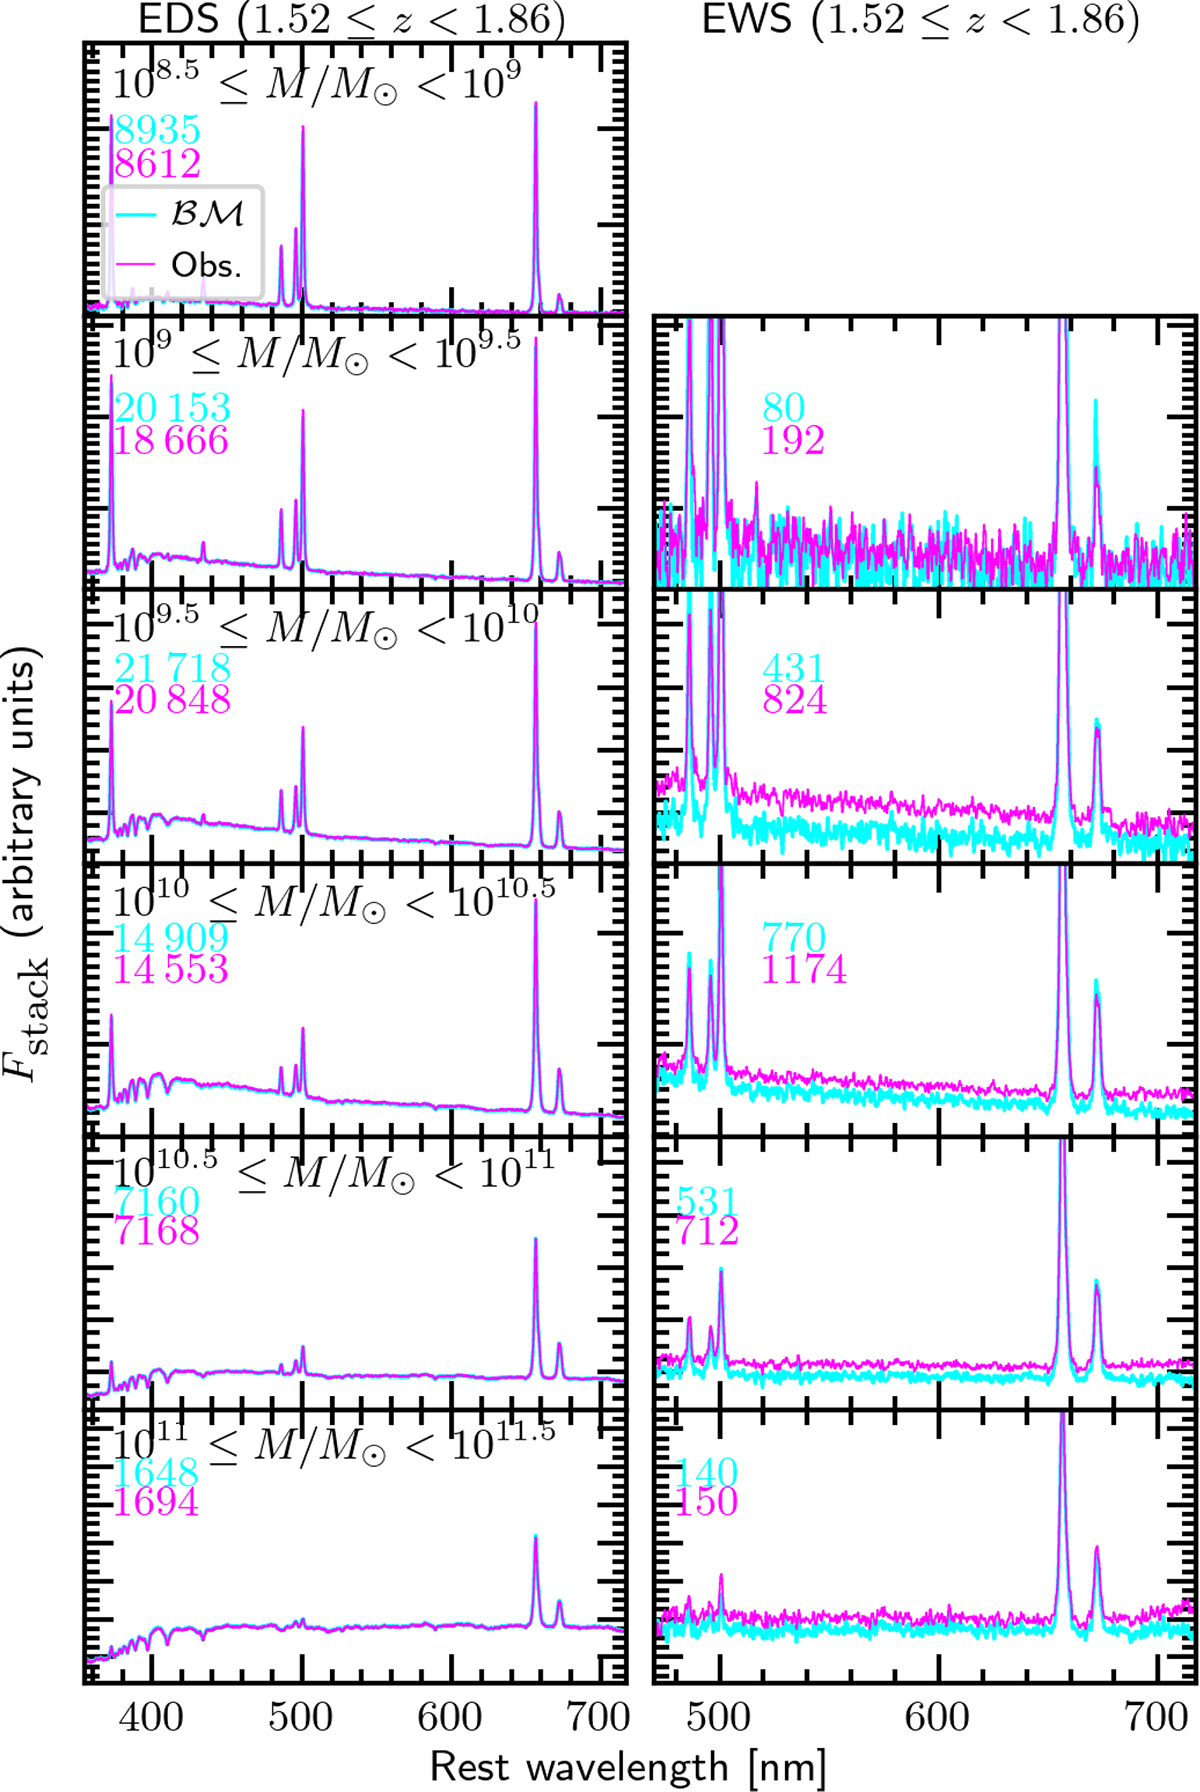
Stacked mean spectra for the mock galaxies used for the scientific predictions in this paper, for the redshift bin [1.52, 1.86]. The panels show stacked spectra divided by sample type and stellar mass bins: left panels show the EDS-SFsim, while right panels show the EWS-SFsim. Rows correspond to stellar mass bins of 0.5 dex, ranging from log10(M*/M⊙)≥8.5 to ≤11.5. Bins with fewer than 50 spectra are not shown or considered in the analysis. In each panel, cyan and magenta spectra represent the stacked spectra for the ℬℳ and observationally selected samples, respectively, with the numbers indicating the spectra counts. Note that the [O III]/[O III]λ4959 ratios of all stacks here are approximately 2.3, lower than the theoretical value of 3, due to an error in the simulated [O III]λ4959 emission line. Since the [O III] values are correct and [O III]λ4959 was not used in the analysis, the results remain unaffected.
Current usage metrics show cumulative count of Article Views (full-text article views including HTML views, PDF and ePub downloads, according to the available data) and Abstracts Views on Vision4Press platform.
Data correspond to usage on the plateform after 2015. The current usage metrics is available 48-96 hours after online publication and is updated daily on week days.
Initial download of the metrics may take a while.