Fig. 14.
Download original image
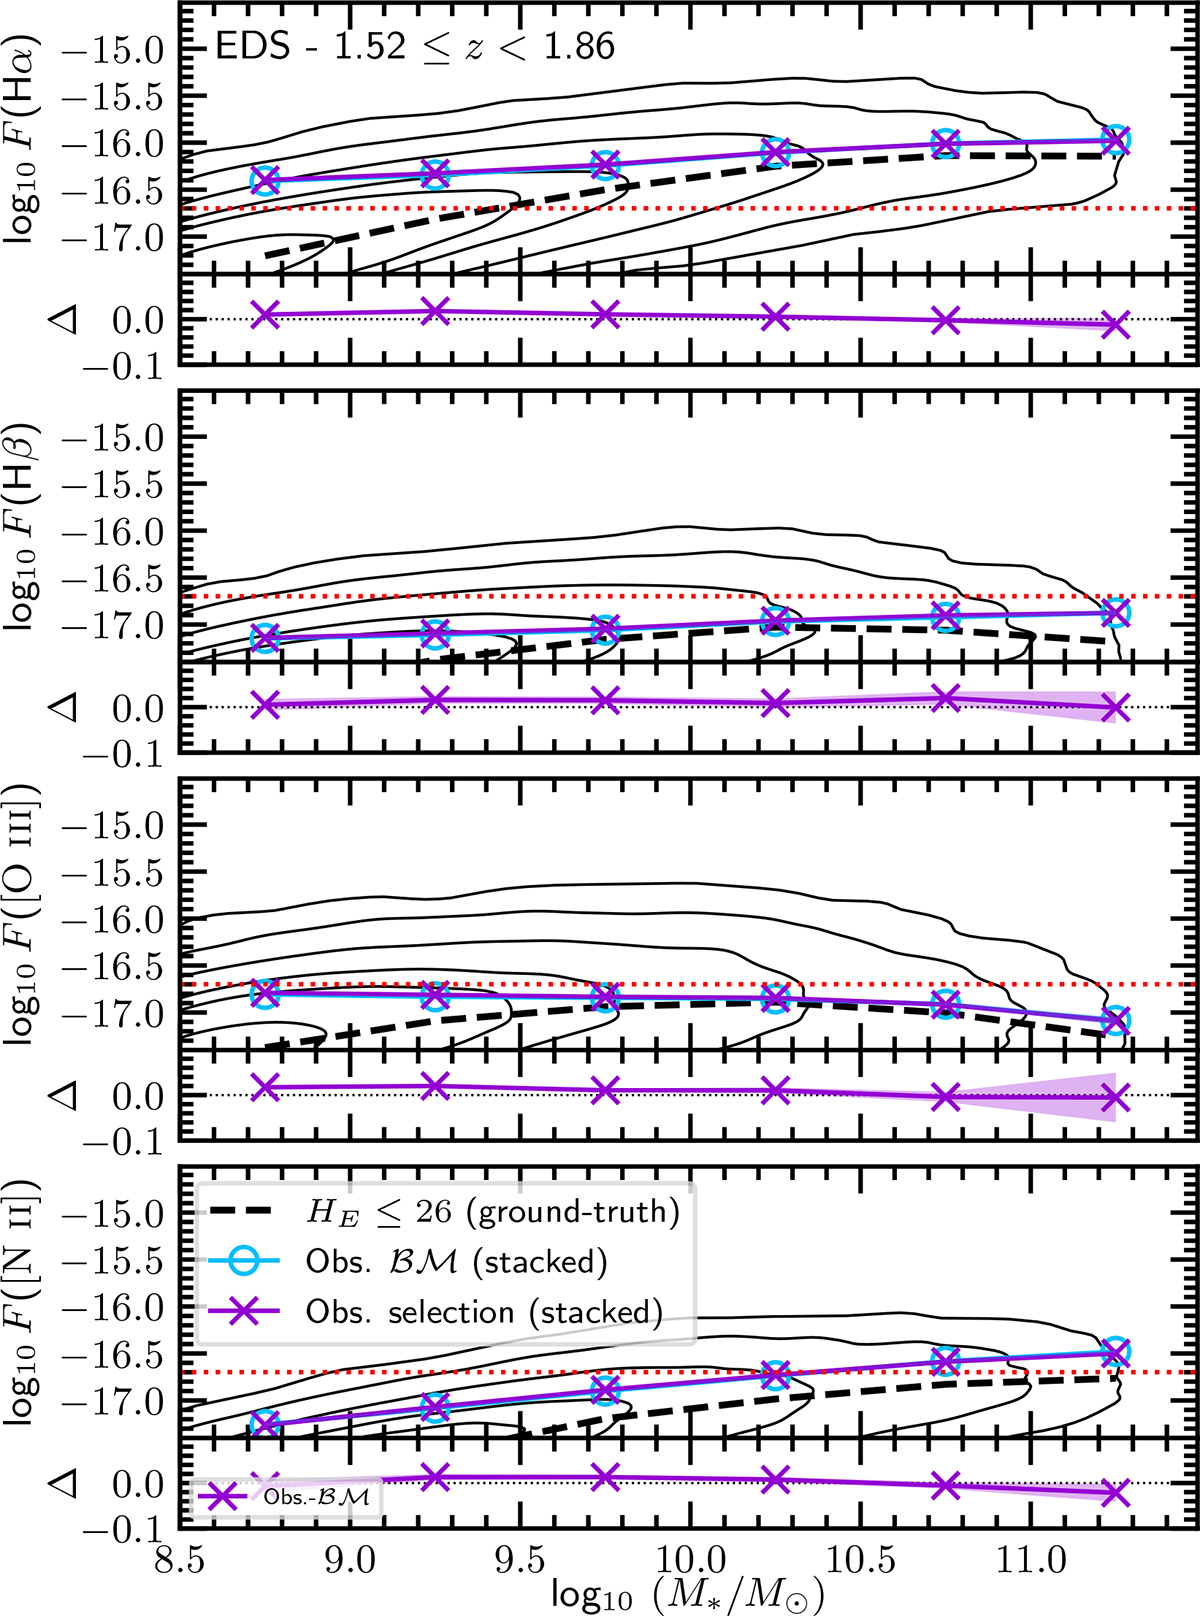
Emission line fluxes (in units of erg s−1 cm−2) measured on stacked spectra as a function of stellar mass for the EDS-SFsim selection corresponding to the redshift interval 1.52 ≤ z ≤ 1.86. From top to bottom, panels show the fluxes of Hα, Hβ, [O III], and [N II] emission lines. Fluxes have been corrected for flux loss using the method by Cassata et al. (in preparation). Magenta curves represent measurements from observationally selected galaxy stacks, whilst cyan circles correspond to benchmark (ℬℳ) stacks. The red dotted horizontal line in each panel indicates the flux limit of 2 × 10⁻¹⁷ erg s−1 cm−2 imposed on the EDS-SFsim. Shaded regions denote the 1σ uncertainty, whilst black contours and the dashed black line in each panel trace the ground-truth distribution and median relation of the parent EDS-SFsim sample (HE ≤ 26), respectively. The bottom insets in each panel show the difference (in dex) between the observational and benchmark flux measurements.
Current usage metrics show cumulative count of Article Views (full-text article views including HTML views, PDF and ePub downloads, according to the available data) and Abstracts Views on Vision4Press platform.
Data correspond to usage on the plateform after 2015. The current usage metrics is available 48-96 hours after online publication and is updated daily on week days.
Initial download of the metrics may take a while.