Fig. 15.
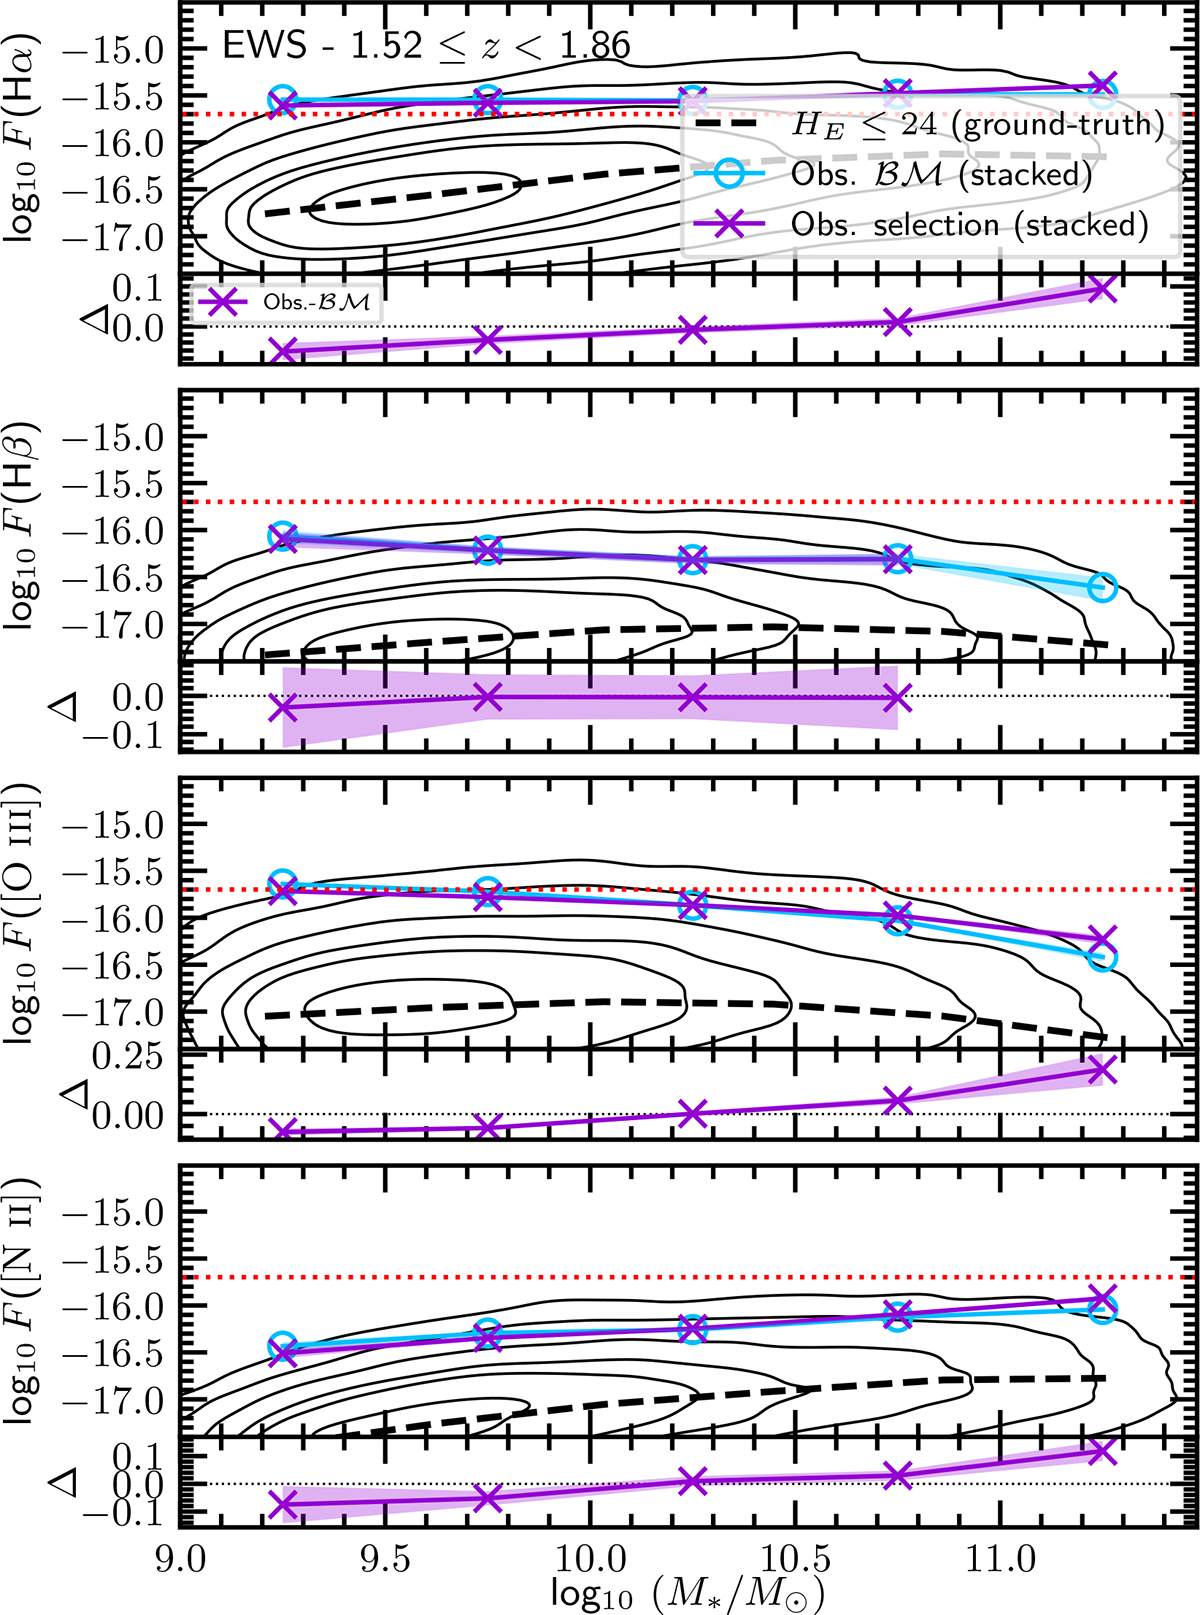
Download original image
Emission line fluxes measured on stacked mock spectra as a function of stellar mass for the EWS-SFsim selection. From top to bottom, panels display the fluxes of Hα, Hβ, [O III], and [N II] emission lines. The red dotted horizontal line in each panel indicates the flux limit of 2 × 10⁻¹⁶ erg s−1 cm−2 imposed on the Hα line. The layout of the panels is the same as in Fig. 14.
Current usage metrics show cumulative count of Article Views (full-text article views including HTML views, PDF and ePub downloads, according to the available data) and Abstracts Views on Vision4Press platform.
Data correspond to usage on the plateform after 2015. The current usage metrics is available 48-96 hours after online publication and is updated daily on week days.
Initial download of the metrics may take a while.