Fig. 17.
Download original image
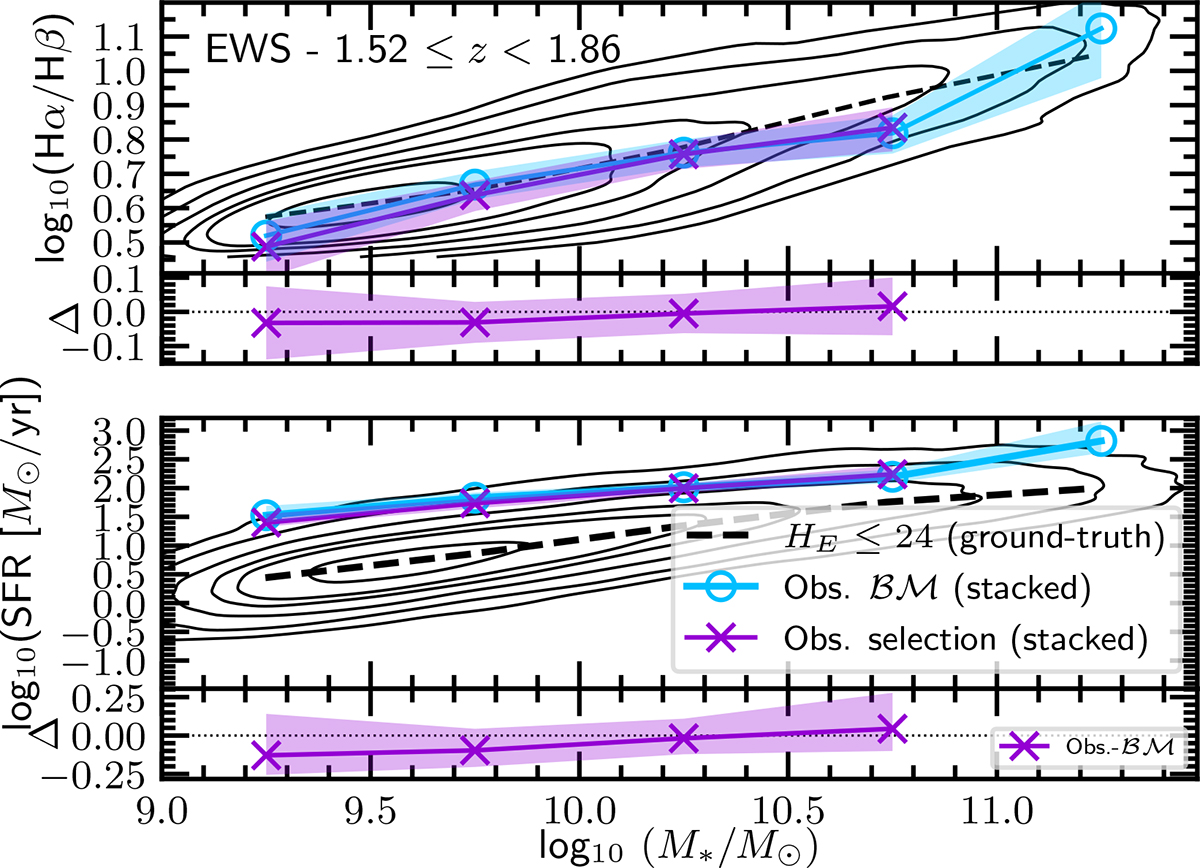
Attenuation–M* relation (top panel) and the SFR–M* relation (bottom panel) derived from the EWS-SFsim stacked mock spectra. The attenuation is measured using the Balmer decrement (Hα/Hβ ratio), whilst the SFR is calculated from the dust-corrected Hα luminosity, applying the Calzetti et al. (2000) extinction law and assuming case B recombination conditions (electron density of 100 cm−2 and temperature of 10 000 K. The panel layout follows the structure of Fig. 14. Shaded regions represent the 1σ uncertainties in the measured quantities.
Current usage metrics show cumulative count of Article Views (full-text article views including HTML views, PDF and ePub downloads, according to the available data) and Abstracts Views on Vision4Press platform.
Data correspond to usage on the plateform after 2015. The current usage metrics is available 48-96 hours after online publication and is updated daily on week days.
Initial download of the metrics may take a while.