Fig. B.2.
Download original image
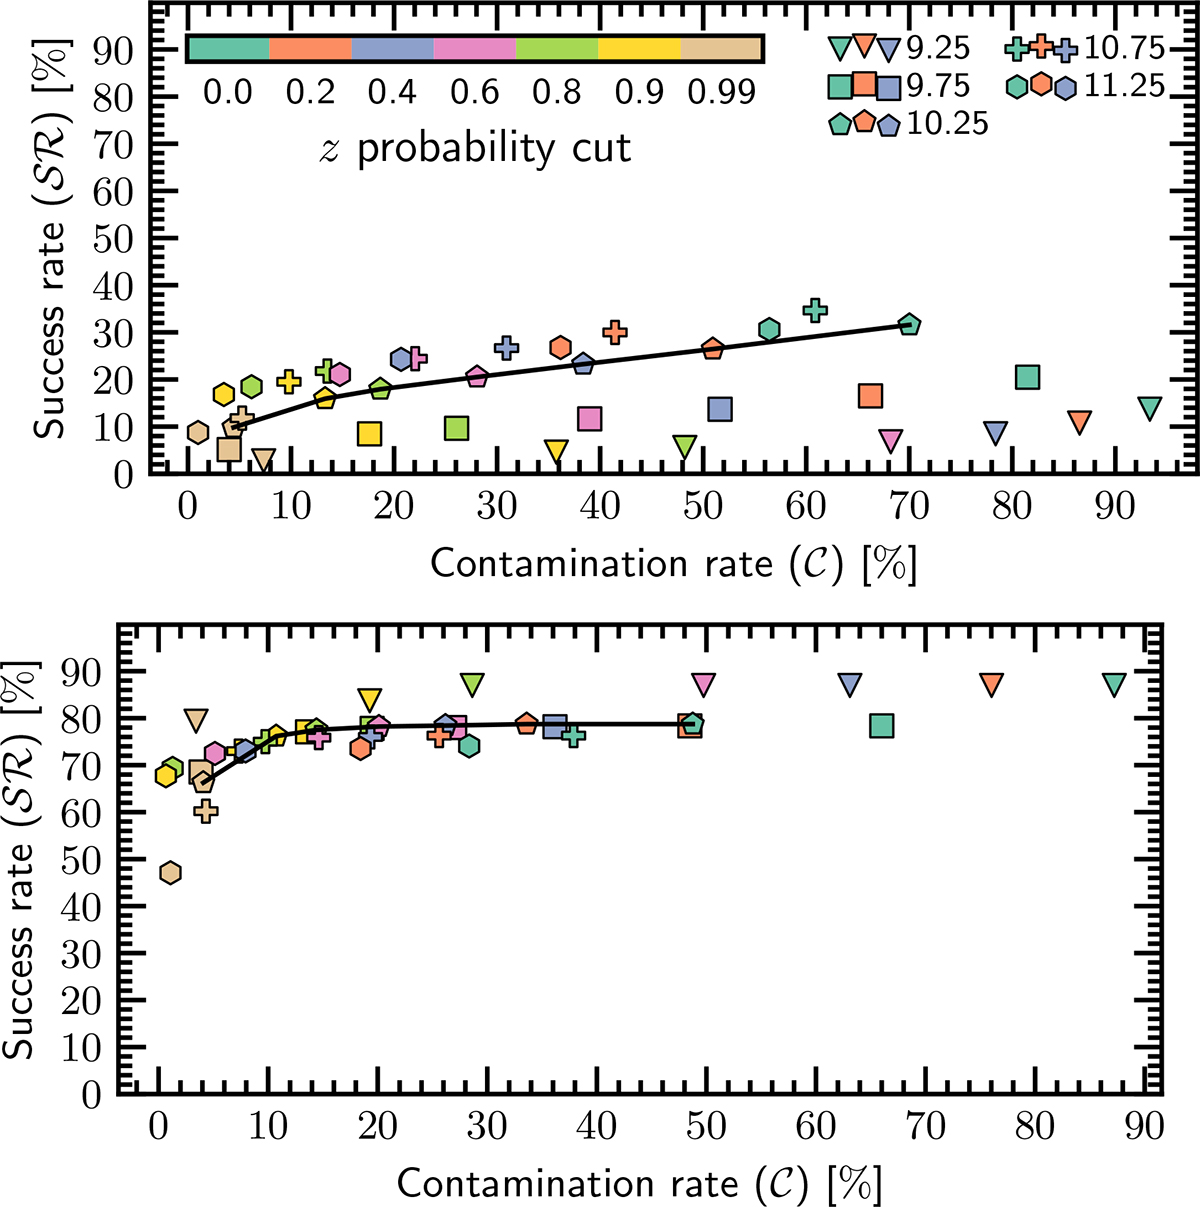
Success rate (𝒮ℛ) vs contamination rate (𝒞) for the mock EWS-SFsim, colour-coded by the applied redshift probability threshold (zprob). The top panel shows results for a flux threshold of 2 × 10⁻¹⁷erg s−1 cm−2, while the bottom panel corresponds to a higher threshold of 2 × 10⁻¹⁶erg s−1 cm−2. Different symbols represent galaxies in distinct stellar mass bins. As a reference, the black curves connect the points corresponding to the mass bin log10(M*/M⊙)∈[10, 10.5].
Current usage metrics show cumulative count of Article Views (full-text article views including HTML views, PDF and ePub downloads, according to the available data) and Abstracts Views on Vision4Press platform.
Data correspond to usage on the plateform after 2015. The current usage metrics is available 48-96 hours after online publication and is updated daily on week days.
Initial download of the metrics may take a while.