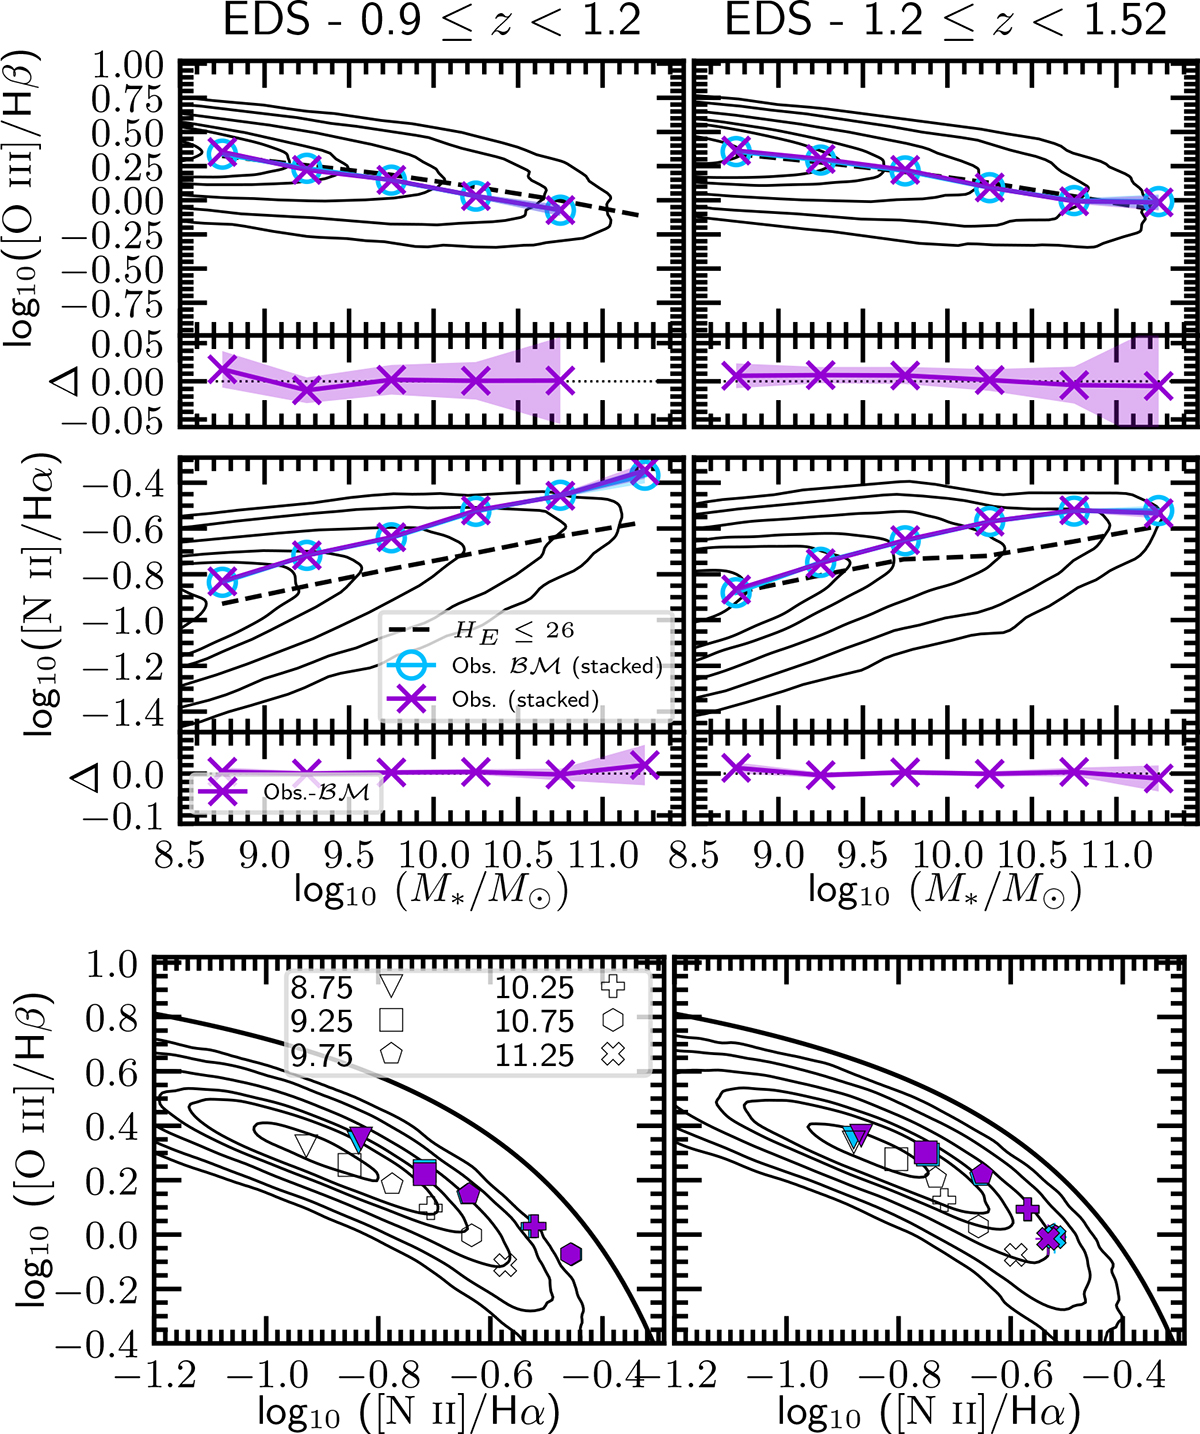
Fig. C.4.
Download original image
BPT diagram and corresponding stellar mass relations for the [O III]/Hβ and [N II]λ6584/Hα ratios based on the EDS-SFsim stacked mock spectra. The top and middle panels show the [O III]/Hβ–stellar mass (i.e. the MEx diagnostic diagram, Juneau et al. 2011), and [N II]λ6584/Hα–stellar mass relations, respectively, with measurements from the stacked spectra in different stellar mass bins. The bottom panel displays the BPT diagram with symbols representing the positions of the stacked spectra for various mass bins. The black contours in all panels represent the EDS-SFsim parent sample cut at HE ≤ 26, and the black dashed curves in the top and middle panels represent its median relations.
Current usage metrics show cumulative count of Article Views (full-text article views including HTML views, PDF and ePub downloads, according to the available data) and Abstracts Views on Vision4Press platform.
Data correspond to usage on the plateform after 2015. The current usage metrics is available 48-96 hours after online publication and is updated daily on week days.
Initial download of the metrics may take a while.