Fig. 3.
Download original image
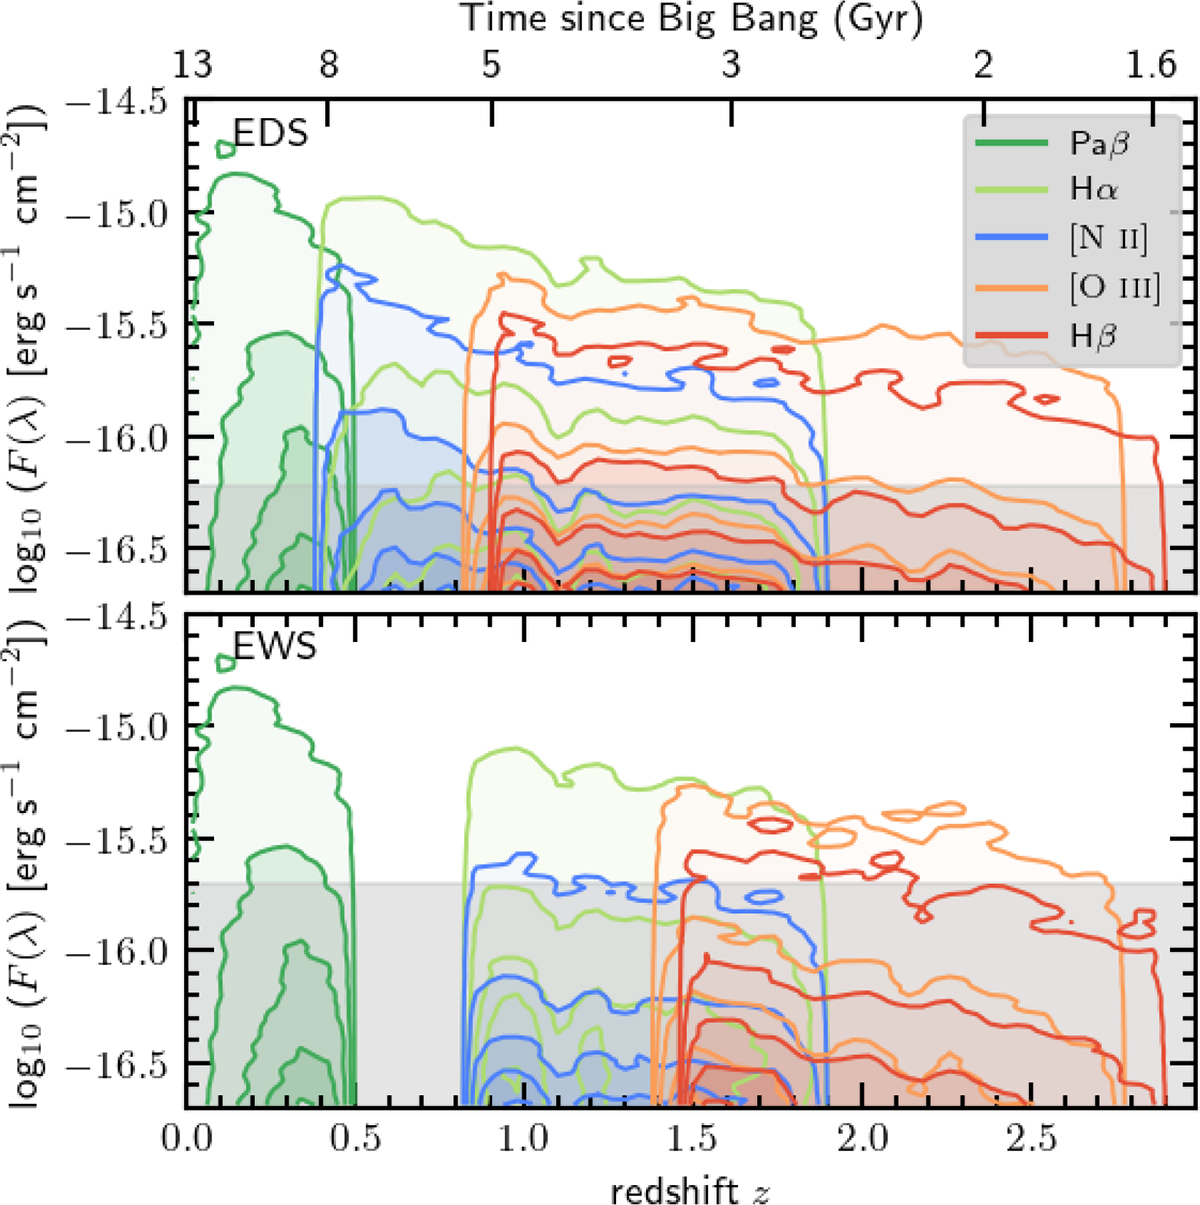
True flux vs redshift for key emission lines in the mock EDS-SFsim (top) and EWS-SFsim (bottom) samples. Contours in dark green, light green, blue, orange, and red correspond to Paβ, Hα, [N II]λ6584, [O III], and Hβ, respectively, selected to span a broad redshift range and wavelength coverage. Each line’s redshift range reflects its detectability within the grism coverage. Contours from lighter to darker shades trace the 99th, 84th, 50th, 16th, and 1st percentiles of the distribution. Grey areas mark fluxes below the survey sensitivity limits.
Current usage metrics show cumulative count of Article Views (full-text article views including HTML views, PDF and ePub downloads, according to the available data) and Abstracts Views on Vision4Press platform.
Data correspond to usage on the plateform after 2015. The current usage metrics is available 48-96 hours after online publication and is updated daily on week days.
Initial download of the metrics may take a while.