Fig. 4.
Download original image
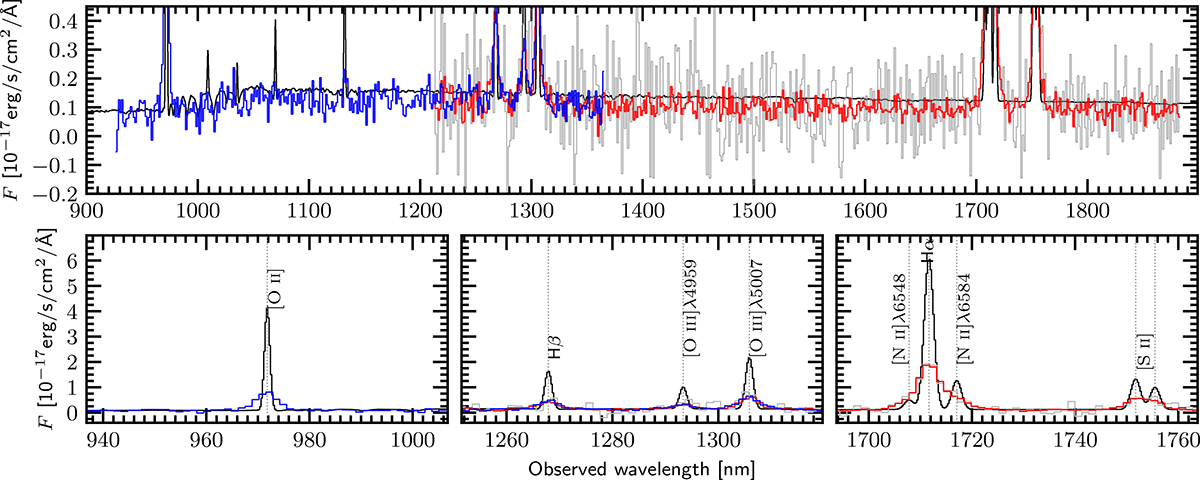
Example of a simulated spectrum from MAMBO of a galaxy at redshift z ∼ 1.6, stellar mass of log10(M*/M⊙) = 10.8, HE ∼ 21.1, SFR of 232.7 M⊙/yr, effective disk radius of ![]() , and a B/T of 0.33. The black spectrum represents the incident model spectrum at its native resolution (∼0.27 nm). The EWS simulated spectrum is shown in grey, whilst the blue and red spectra correspond to the EDS blue and red grism simulated observations, respectively. The top panel focuses on the stellar continuum, whilst the bottom panels highlights key emission lines spectral regions: note how the increased survey depth of the EDS allows for the detection of fainter emission lines, such as [O III]λ4959.
, and a B/T of 0.33. The black spectrum represents the incident model spectrum at its native resolution (∼0.27 nm). The EWS simulated spectrum is shown in grey, whilst the blue and red spectra correspond to the EDS blue and red grism simulated observations, respectively. The top panel focuses on the stellar continuum, whilst the bottom panels highlights key emission lines spectral regions: note how the increased survey depth of the EDS allows for the detection of fainter emission lines, such as [O III]λ4959.
Current usage metrics show cumulative count of Article Views (full-text article views including HTML views, PDF and ePub downloads, according to the available data) and Abstracts Views on Vision4Press platform.
Data correspond to usage on the plateform after 2015. The current usage metrics is available 48-96 hours after online publication and is updated daily on week days.
Initial download of the metrics may take a while.