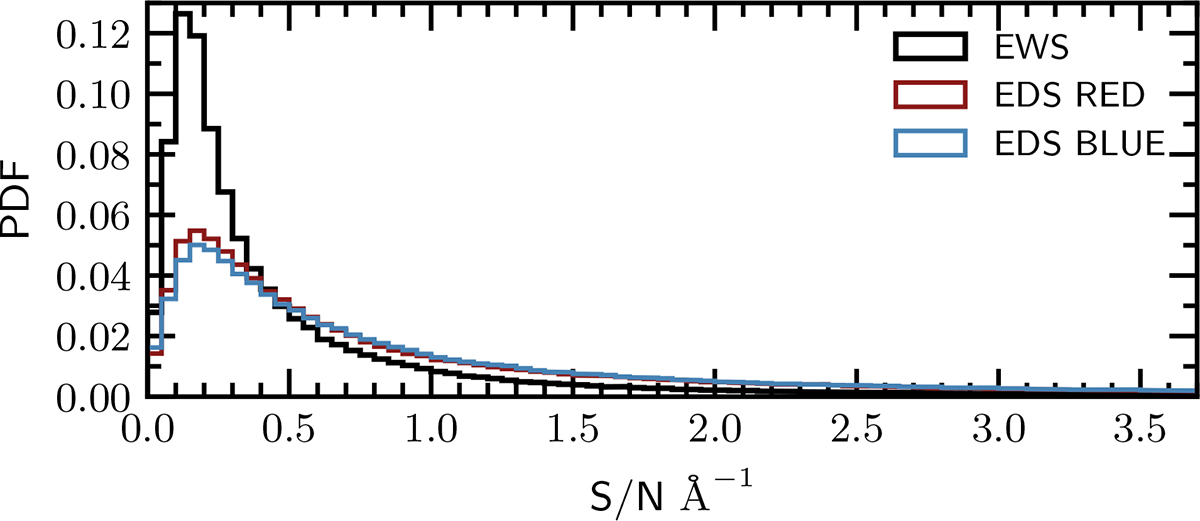
Fig. 5.
Download original image
Distribution of the continuum S/N per Å for the sample of simulated MAMBO spectra (see Sect. 4.1), providing a reference for typical input spectra quality. The black line represents the EWS MAMBO sample, selecting galaxies with HE < 24. The red and blue lines correspond to the EDS red and blue MAMBO samples, respectively, selecting galaxies at the survey limit of HE < 26.
Current usage metrics show cumulative count of Article Views (full-text article views including HTML views, PDF and ePub downloads, according to the available data) and Abstracts Views on Vision4Press platform.
Data correspond to usage on the plateform after 2015. The current usage metrics is available 48-96 hours after online publication and is updated daily on week days.
Initial download of the metrics may take a while.