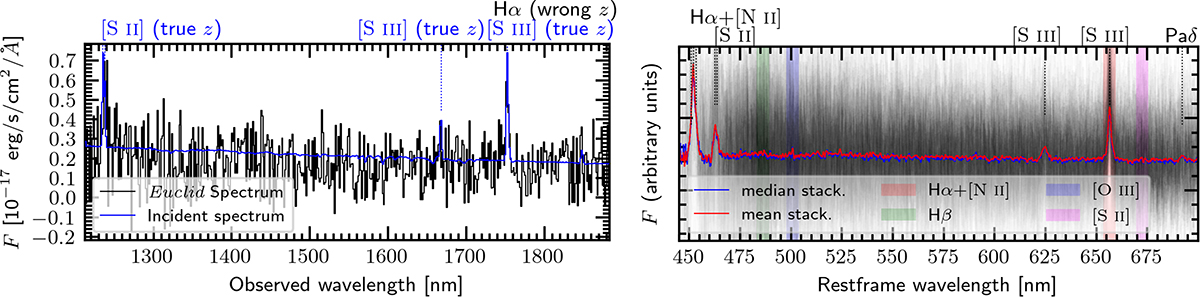
Fig. 7.
Download original image
Left panel: Example of redshift contaminants due to [S III]λ9531 at 1752.7 nm mis-identified as Hα, yielding zmeas = 1.67 instead of ztrue = 0.836. Right panel: Median (in blue) and mean (in red) stack of 200 spectra (in grey) of galaxies where the [S III]λ9531 line was misinterpreted as Hα. Vertical dotted lines indicate the ‘true’ lines, while the coloured bands highlight the expected rest-frame positions of key optical emission lines at the wrong redshift of the stacked spectrum (Hβ, [O III], Hα, and [N II]).
Current usage metrics show cumulative count of Article Views (full-text article views including HTML views, PDF and ePub downloads, according to the available data) and Abstracts Views on Vision4Press platform.
Data correspond to usage on the plateform after 2015. The current usage metrics is available 48-96 hours after online publication and is updated daily on week days.
Initial download of the metrics may take a while.