Fig. 8.
Download original image
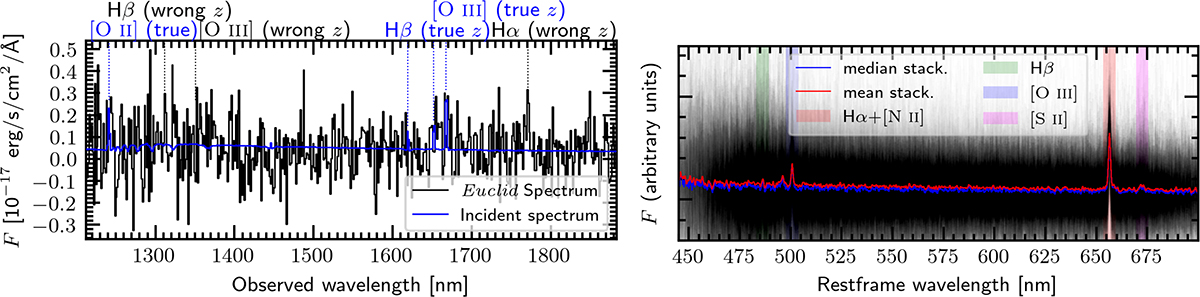
Left panel: Example where a random noise spike is misinterpreted as the Hα emission line, leading to an erroneous redshift measurement. Right panel: Median (in blue) and mean (in red) stacked spectrum of 500 spectra (in grey) of galaxies with misclassified redshift, illustrating the accumulation of these spurious noise spikes at notable lines positions.
Current usage metrics show cumulative count of Article Views (full-text article views including HTML views, PDF and ePub downloads, according to the available data) and Abstracts Views on Vision4Press platform.
Data correspond to usage on the plateform after 2015. The current usage metrics is available 48-96 hours after online publication and is updated daily on week days.
Initial download of the metrics may take a while.