Fig. 9.
Download original image
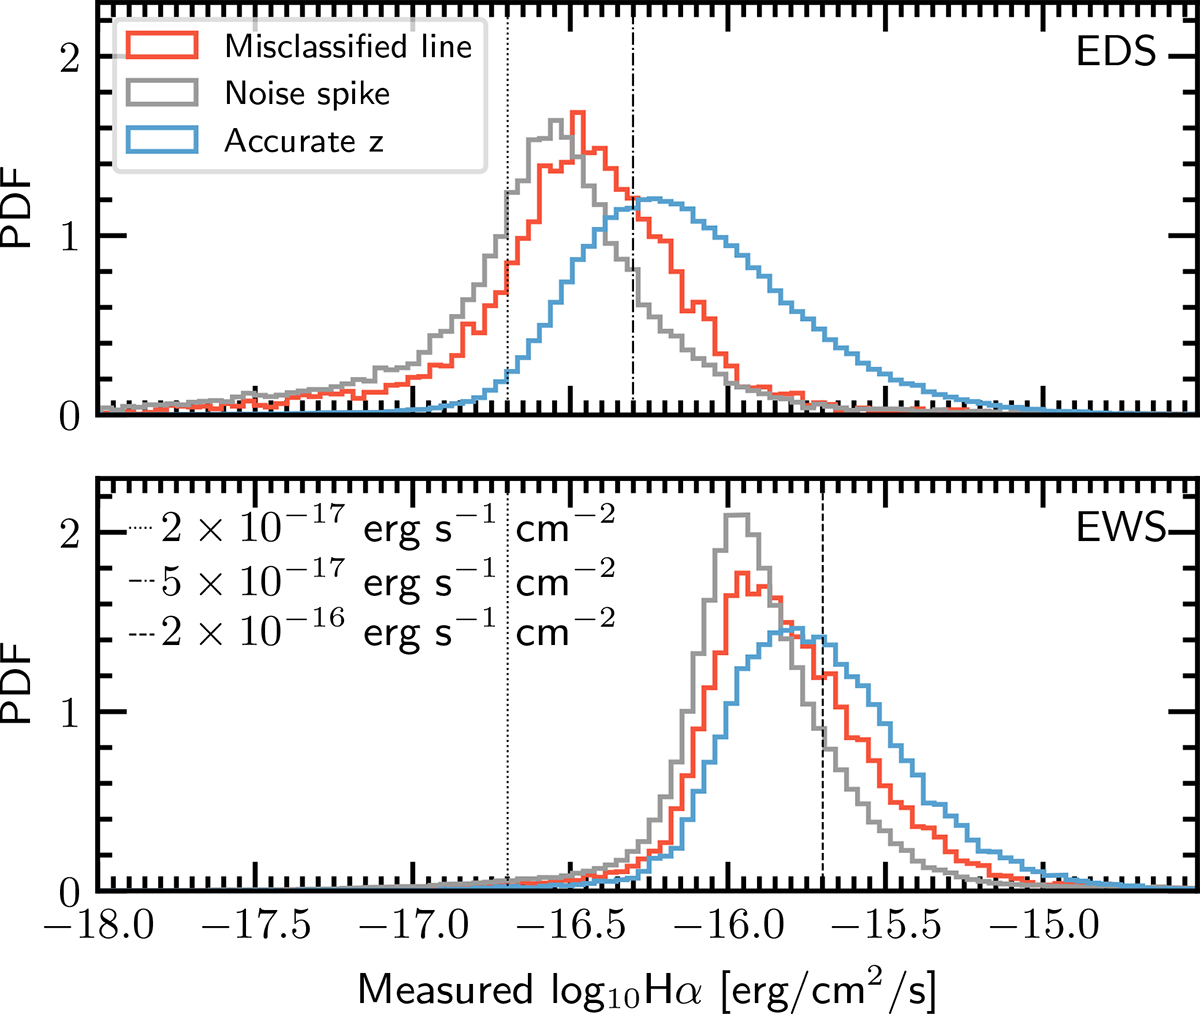
Distribution of measured Hα fluxes (corrected for flux loss following Cassata et al., in prep.) versus true Hα fluxes for the EDS-SFsim (top) and EWS-SFsim (bottom) simulated samples. Blue histograms show galaxies with accurate redshifts with |Δz|/(1 + z)≤0.003, red histograms indicate contaminants from mis-identified emission lines, and grey histograms represent contaminants from noise spikes.
Current usage metrics show cumulative count of Article Views (full-text article views including HTML views, PDF and ePub downloads, according to the available data) and Abstracts Views on Vision4Press platform.
Data correspond to usage on the plateform after 2015. The current usage metrics is available 48-96 hours after online publication and is updated daily on week days.
Initial download of the metrics may take a while.