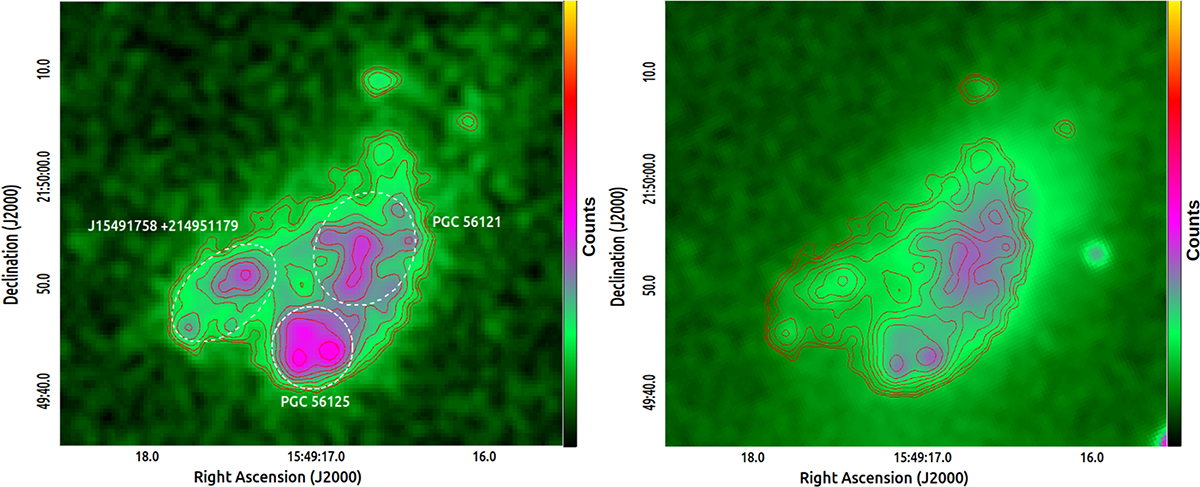
Fig. 2.
Download original image
Surface brightness contour map of three sources : PGC 56121, PGC 56125, and J15491758 +214951179. Left: The contour levels plotted are 4σ, 5σ, 7σ, 11σ, 16σ, 22σ, 34σ, and 55σ above the background level on far-UV image. Regions highlighted in pink represent areas of higher flux density and are likely associated with active star-forming regions, while the green shaded areas denote more diffuse emission, possibly due to gas with lower luminosity. Objects analyzed in this study are outlined by white dashed regions. Right: Contours derived from the FUV data overlaid on the SDSS r-band image for a comparison and to identify star-forming and brighter regions.
Current usage metrics show cumulative count of Article Views (full-text article views including HTML views, PDF and ePub downloads, according to the available data) and Abstracts Views on Vision4Press platform.
Data correspond to usage on the plateform after 2015. The current usage metrics is available 48-96 hours after online publication and is updated daily on week days.
Initial download of the metrics may take a while.