| Issue |
A&A
Volume 707, March 2026
|
|
|---|---|---|
| Article Number | A248 | |
| Number of page(s) | 9 | |
| Section | Extragalactic astronomy | |
| DOI | https://doi.org/10.1051/0004-6361/202557341 | |
| Published online | 10 March 2026 | |
AstroSat-UVIT observations of a possibly interacting pair of galaxies in HCG 77
1
Indian Institute of Science Education and Research, Mohali, SAS Nagar Punjab, 140306, India
2
Thapar Institute of Engineering and Technology, Patiala, Punjab, 147004, India
3
Tata Institute of Fundamental Research, Mumbai, 400005, India
★ Corresponding authors: This email address is being protected from spambots. You need JavaScript enabled to view it.
; This email address is being protected from spambots. You need JavaScript enabled to view it.
; This email address is being protected from spambots. You need JavaScript enabled to view it.
Received:
20
September
2025
Accepted:
22
December
2025
Abstract
Context. Interactions and mergers possibly enhance the star formation in dwarf galaxies in a group environment.
Aims. We aim to study star-forming regions and the spectral energy distribution of two possibly interacting galaxies, PGC 56121 and PGC 56125, in the Hickson Compact Group 77.
Methods. We utilized the far-ultraviolet (FUV) channel of the Ultra Violet Imaging Telescope (UVIT) on board AstroSat to observe and produce FUV images of the galaxies. Our FUV images are at a much higher resolution in comparison to those obtained from previous galaxy surveys by GALEX in the near-UV and those from PS-1, DSS.
Results. We have identified several star-forming regions in the two possibly interacting galaxies, PGC 56121 and PGC 56125. These two galaxies form a pair widely separated in redshift and are seen in projection. We also report the presence of a candidate tidal dwarf galaxy at the end of one of the tidal tails located to the east of the pair, and we identified three major star-forming regions in the tidal dwarf. The spectral energy distribution of three galaxies in the system is presented and analyzed to investigate the key physical properties, such as stellar mass, dust mass, total luminosity, and star formation history, of the three galaxies. Based on these observations and on a comparison with observations in radio, these three galaxies are probably part of a small group of interacting galaxies.
Key words: techniques: image processing / galaxies: dwarf / galaxies: groups: general / galaxies: interactions / galaxies: photometry / ultraviolet: general
© The Authors 2026
 Open Access article, published by EDP Sciences, under the terms of the Creative Commons Attribution License (https://creativecommons.org/licenses/by/4.0), which permits unrestricted use, distribution, and reproduction in any medium, provided the original work is properly cited.
This article is published in open access under the Subscribe to Open model. This email address is being protected from spambots. You need JavaScript enabled to view it. to support open access publication.
1. Introduction
Galaxy interactions represent one of the most dynamic and influential processes in the evolution of the Universe. These gravitational encounters, ranging from close flybys to full-scale mergers, play a pivotal role in shaping the structure, composition, and star formation activity of galaxies. From minor tidal disruptions that trigger localized starburst regions to cataclysmic mergers that forge giant elliptical galaxies, such interactions have been shown to significantly impact galactic growth and evolution (Toomre & Toomre 1972; Barnes & Hernquist 1992).
Galaxy interactions occur across all mass and length scales, from encounters between massive spirals and ellipticals to those involving the smallest dwarf systems. Dwarf galaxies are the most common galaxy type in the Universe, and they serve as crucial building blocks in hierarchical galaxy formation models. Their evolution is strongly shaped by both internal mechanisms, such as stellar feedback, and external interactions, such as tidal forces. Dwarf galaxies in pairs or small groups often exhibit elevated star formation rates (SFRs). Previous surveys found that interacting dwarf pairs can exhibit enhancements in SFR compared to their isolated counterparts (Stierwalt et al. 2015). Interacting dwarfs show an increase in SFR relative to non-interacting galaxies in the stellar mass range 107 − 108 M⊙ (Subramanian et al. 2024).
While major mergers significantly enhance star formation, many morphological disturbances in dwarfs arise from minor interactions or flybys. Mergers moderately boost SFRs, but more frequent non-merging interactions cumulatively contribute significantly to stellar mass growth over cosmic time (Martin et al. 2020). Among the outcomes of dwarf–dwarf or dwarf–giant interactions, tidal dwarf galaxies (TDGs) are particularly intriguing, as they originate from preenriched material stripped from parent galaxies. Understanding the nature of these systems is crucial to assessing how tidal interactions shape the formation and evolution of dwarf galaxies either in groups or in compact groups.
An atlas of compact groups was provided by Hickson (1993). It contains a collection of galaxies designated as Hickson Compact Groups (HCGs), and has a list of one hundred groups. HCG 77 is one of them (Hickson 1982). In the original classification scheme, four galaxies were considered members of this group: PGC 51625, PGC 56121, UGC 10049, and PGC 56122. Later, using the redshift measurements, Hickson showed that the first two members have low redshifts very close to each other, and thus they either form a pair or are part of a single galaxy Hickson (1993). The other two objects, which are much redder in color, have much larger redshifts, probably forming a completely different pair of galaxies, and they cannot be considered as belonging to HCG 77. The group, therefore, has been misclassified as a compact group. However, observations with the Very Large Array show that the galaxies PGC 56121 and PGC 56125 may be part of a small local group, the most massive galaxy being UGC 10043 (Matthews & de Grijs 2004; Aguirre et al. 2009).
In this paper, we present far-ultraviolet (FUV) observations of HCG 77, where our focus is to study the pair of galaxies. This pair is located at a redshift of z = 0.006969 ± 5.55E − 6 and z = 0.007505 ± 2.10E − 4 corresponding to a distance of d ≈ 29.80 ± 0.02 Mpc and d ≈ 32.15 ± 0.90 Mpc (with H0 = 70 km/s/Mpc) respectively. We performed aperture photometry of the star-forming complexes, and spectral energy distribution (SED) analysis of the system to obtain physical parameters such as the stellar mass, SFR, and specific SFR. The physical parameters are consistent with these galaxies being irregular and blue compact dwarfs. We also show the presence of a candidate TDG at the end of one of the tidal tails, whose size and color are consistent with the statistical study in Kaviraj et al. (2011).
Observational studies and numerical simulations have shown that gravitational interactions can induce gas inflows, trigger starburst activity, and lead to the transformation of late-type spirals into early-type galaxies (Mihos & Hernquist 1996; Hopkins et al. 2008). In addition to influencing star formation, galaxy interactions can also ignite nuclear activity. Tidal torques and dynamical friction can funnel gas toward the central regions of galaxies, feeding supermassive black holes and triggering active galactic nuclei activity (Hernquist 1989; Hopkins et al. 2006). The correlation between starburst and active galactic nuclei phases in interacting galaxies supports the idea of a coevolutionary link between black hole growth and galaxy evolution (Kormendy & Ho 2013). Such processes are especially prominent in dense environments, such as compact groups or clusters, where close encounters and repeated interactions are more frequent (McIntosh et al. 2008; Hickson 1982). By examining interacting systems across multiple wavelengths (e.g., ultraviolet, optical, infrared, and radio wavelengths), we can gain comprehensive insight into the physical mechanisms driving galaxy transformation in the evolving Universe.
The paper is organized as follows. In Sect. 2 we present the observational details. In Sect. 3 we discuss the image reduction pipeline used for the data. The final images, surface brightness contours, comparison with other images, identification, and photometry of the SFRs are presented in Sect. 4. We present the SED modeling and infer various physical parameters of the system in Sect. 5. Section 6 presents a discussion of our results, and Sect. 7 provides a summary of the study.
2. Observation
Observations of a field centered on HCG 77 were carried out by the Ultra-Violet Imaging Telescope (UVIT) (Tandon et al. 2017) on board the AstroSat (Singh et al. 2014). The UVIT employs an f/12 Ritchey-Chretien telescope with an aperture of 375 mm and has an intensified C-MOS imager at its focus. The observations were carried out on 18 February 2022, starting at 00:46:00, in the photon counting mode and using the BaF2 filter with a central wavelength of 154 nm and a bandwidth of 38 nm defining the FUV band. A useful exposure of 11042.765 seconds was obtained from 15 orbits of the satellite. These observations covered a large field of view of 28′ (or ∼0.5°) with an angular resolution of ∼1.4″. The ID of the observation is A05_167T01_9000004940, and the PI of the observations is H.K. Jassal.
3. UVIT reduction pipeline
Level 1 (L1) data from the observation were obtained from the Indian Space Science Data Center (ISSDC) archive1. The L1 data contain information about the orbits and raw photon events detected in the FUV channels. The data reduction was done via a pipeline with the help of CCDLAB Postma & Leahy (2021). The process included aligning of all the different orbit images and combining them into a single image, which reduces the further rotational and translational movements of the sources in the image. The optimization process reduced the point spread function of all the bright sources, and the World Coordinate System solution was applied to obtain the coordinate grid of right ascension & declination of the image. After finalizing the science product, we obtained the final FUV image of the field, which was ready for analysis.
4. Data and image analysis
The FUV images of all the bright galaxies in the field of HCG 77 surveyed using the UVIT are shown in Figure 1. Table 1 lists basic information on the galaxies. In addition to our UVIT/AstroSat observations, we utilized archival data from the SIMBAD Astronomical Database (Wenger et al. 2000), the NASA/IPAC Extragalactic Database (NED; Helou et al. 1991), and the Sloan Digital Sky Survey (SDSS; Ahumada et al. 2020; Jönsson et al. 2020; Albareti et al. 2017).
Properties of the galaxies observed in the UVIT field.
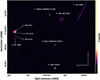 |
Fig. 1. Far-UV images of galaxies in the field of view of the UVIT telescope while observing the HCG 77 region. |
In this Table, the first two objects listed are a possible interacting pair of galaxies, i.e., PGC 56121 and PGC 56125. These two galaxies and those marked 3 and 4 are visible as two separate objects in the optical and 21 cm2. The object at no. 5 is an isolated galaxy. Objects listed at 6 and 7 are observed to be physically connected by hydrogen gas (H I; 21 cm), as initially presented by Aguirre et al. (2009) and further characterized by Bahr & Mosenkov (2025). MCG +04-37-035 is a distorted galaxy interacting with UGC 10043, which is an edge-on barred spiral (type Sbc) galaxy in Figure 1. Object 8 is an isolated galaxy in the frame, and the last object, LEDA 1656651, is a galaxy in a pair.
The point spread function value was determined by analyzing a bright point source (RA: 15:50:04, Dec: +21:48:18) in the field of view image and measuring the intensity profile along the radial direction. We noted the counts from the pixel table from the center of the source to the endpoints in both directions, which are diametrically opposite. A Gaussian fit was plotted from the datasets, which helped in obtaining the standard deviation. The deviation value we obtained was 1.34 (σ = 1.34) and the full width half maximum value was 3.15 (FWHM = 2.354 ⋅ σ = 3.15). Since each value here denotes the pixel count, using the conversion factor for UVIT (1 pixel = 0.4168 arcsecond), we therefore obtained a final point spread function value of approximately 1.30 arcseconds for our FUV image, which is consistent with the expected resolution for the BaF2 (F154W) filter. This confirmed that the image is well-calibrated and suitable for further analysis.
We obtained a well-resolved image of HCG 77 using UVIT on board AstroSat, which formed the basis of our analysis. To analyze the flux distribution and identify structural features in the interacting galaxy system HCG 77, we generated surface brightness contour maps using SAOImage DS9 (Joye & Mandel 2003), shown in Figure 2. We estimated the mean background level estimated to be 0.44, with a deviation of 0.35. These contours trace regions of equal flux, allowing us to distinguish between dense star-forming zones and more diffuse extended emission. Higher contour levels correspond to regions of greater luminosity, which are likely indicative of ongoing star formation, while lower levels highlight fainter and possibly gas-dominated areas. This visualization aids in understanding the spatial distribution of activity across the system. The figure also marks the three primary regions examined in detail: the galaxies PGC 56121 and PGC 56125 along with J15491758 +214951179. The source J15491758 +214951179 exhibits a tidal tail-like feature, which appears to be emerging from the parent galaxy, suggesting it is a coherent part of the tidal structure originating from PGC 56121. These sources constitute the main focus of this study.
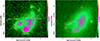 |
Fig. 2. Surface brightness contour map of three sources : PGC 56121, PGC 56125, and J15491758 +214951179. Left: The contour levels plotted are 4σ, 5σ, 7σ, 11σ, 16σ, 22σ, 34σ, and 55σ above the background level on far-UV image. Regions highlighted in pink represent areas of higher flux density and are likely associated with active star-forming regions, while the green shaded areas denote more diffuse emission, possibly due to gas with lower luminosity. Objects analyzed in this study are outlined by white dashed regions. Right: Contours derived from the FUV data overlaid on the SDSS r-band image for a comparison and to identify star-forming and brighter regions. |
4.1. Photometry
After obtaining the complete image, we performed aperture photometry using Source Extractor (SEXTRACTOR) software Bertin & Arnouts (1996). In this process, we detected and extracted the sources that were responsible for emitting flux during galaxy interactions. We extracted the sources from a subsection of the entire FUV image centered on the HCG 77 group. The minimum number of pixels to be considered a detection (DETECT_MINAREA) was set to seven, which is approximately equal to the area of the circle with a diameter 3 pixels (which is the value of the point spread function we obtained). We kept the value DETECT_THRESH 3σ so that SEXTRACTOR detects objects with flux values of 3σ or above, where σ is the average background noise. Although lower thresholds capture extended sources, SEXTRACTOR would also take into account noises, and a higher threshold may reduce false detections, SEXTRACTOR but would also miss faint sources, so the value 3σ is good to start with. For the background parameters, we took BACK_TYPE = AUTO and BACK_SIZE = 64 pixels. The value of the zero-point magnitude (MAG_ZEROPOINT) we used was 17.78 for FUV BaF2 (F154W), which was taken from Tandon et al. (2020), where they provided additional calibration of UVIT on board AstroSat. For the apertures, we used ellipses that have appropriate values of minimum radius, the Kron factor, and the Petrosian factor. Several key parameters used in our analysis were adopted from studies based on FUV observations by Samantaray et al. (2024) and Mahajan et al. (2022). The parameters used for source extraction are listed in Table 2.
SEXTRACTOR parameters used for the analysis of the UVIT FUV images.
Source Extractor was used to identify sources in the image and to obtain initial estimates of the flux contributing sources through elliptical apertures. While SEXTRACTOR is most effective for detecting point sources and compact galaxies in wide fields, studying resolved structures within a galaxy and investigating individual star-forming regions required us to manually define appropriate regions of interest by looking at the images and performing photometric measurements directly. SEXTRACTOR served primarily as an indicative tool to locate possible sources, while detailed analysis of individual regions was carried out manually.
4.2. SFR determination
Figure 3 depicts the star-forming regions identified with the help of Source Extractor along with those defined manually. The background regions provide the background value, which can be used to determine the correct fluxes of star-forming regions. After identifying the star-forming regions, we determined the SFRs in these regions. The FUV-based SFR was calculated using the relation provided by Iglesias-Paramo et al. (2006):
 (1)
(1)
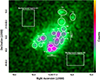 |
Fig. 3. Star-forming regions identified within the diffuse gas of the system. Regions R1–R13 mark the star-forming sites detected through photometry. Background regions B1 and B2 were selected to estimate the background counts. Regions T1-T3 represent a gas trail that is also associated with star formation. |
Luminosities of the regions were calculated by the counts value and then converted into the flux as prescribed in the AstroSat instrument calibration3. Since our analysis was based on the FUV BaF2 (F154W) filter image, we adopted the values of the unit conversion factor, mean wavelength (λmean), and bandwidth (Δλ) from the provided table. The extinction AFUV was also taken into account, which is given by AFUV = 8.06 × E(B − V) following Bianchi (2011). The reddening value for HCG 77 was obtained from the IRSA Dust Extinction Service4, which provides values based on Schlafly & Finkbeiner (2011). We adopted their result, yielding a reddening of E(B − V)≈0.05, and consequently obtained an extinction value AFUV ≈ 0.396. The details of the area of the star-forming regions, their luminosities, and SFRs are given in Table 3.
Area, luminosity, and SFR of the identified star-forming regions.
5. Spectral energy distribution
We modeled the SED of the two galaxies PGC 56125 and PGC 56121 and the source J15491758 +214951179 using ultraviolet data from our analysis complemented by archival optical and infrared data. The resulting SED modeling provides key physical parameters of galaxies, including stellar mass, luminosity, SFR, metallicity, and the chemical composition of their surrounding environment.
5.1. Dataset
We obtained the optical and infrared dataset from the SDSS and Vizier photometry database via SIMBAD. For the optical band, we used SDSS data containing five filters: u, g, r, i, and z. The information of the fluxes and errors was obtained from the FITS image of five SDSS filters. For the infrared band, we used WISE data containing W1, W2, W3, and W4 filters, and the information about their exposure times, fluxes, errors, and wavelengths was obtained from the Vizier catalog5.
We modeled the SEDs of three sources: one with a semimajor axis of ∼6″ and a semiminor of ∼5″ centered at 237.3199421°, 21.8311516° for PGC 56121; another of radius ∼4.2″ centered at 237.3213249°, 21.8288304° for PGC 56125; and the last with a semimajor axis of ∼6.3″ and a semiminor axis of ∼3.7″ centered at 237.3239517°, 21.8304228° for J15491758 +214951179. We gathered the properties and dynamics of the system. The measured values of the fluxes and errors in the different filters are given in Table 4.
Photometric observations used in the SED fitting for PGC 56121, PGC 56125, and J15491758 +214951179.
Photometric measurements were carried out on the FUV image obtained with UVIT using a fixed aperture size centered on the galaxy. The same aperture size and position were adopted for all other bands to ensure that the derived fluxes correspond to the same projected region on the sky. Multiwavelength photometric data from surveys such as SDSS and WISE were obtained via the VizieR photometry services using the same aperture radius. The selected aperture size was sufficiently chosen to minimize potential flux losses or color biases.
For the calculation of flux for the FUV F154W filter, we used the expression
 (2)
(2)
where λ is the mean wavelength of the filter. Here, it is 1541 Å. The term “CPS” is the counts per second measured from the SAOImage DS9 region statistics, which takes into account background counts and errors, and “UC” is the unit conversion factor in ergs per second per centimeter square per angstrom from AstroSat instrument calibration6, and finally we calculated Fν and its error in Janskys. For the calculation of flux for the SDSS filters, the BUNIT was given in “nanomaggy”, which describes the physical counts value per pixel. The total number of counts gives the total nanomaggy, which can be converted into flux using the conversion 1 nanomaggy = 3.631 × 10⁻⁶ Jy (Abdurro’uf et al. 2022).
5.2. Modeling the SED
We modeled the SED of the galaxies using the Multi-wavelength Analysis of Galaxy Physical Properties (MAGPHYS) package (da Cunha et al. 2008). It allowed us to interpret observations for a wide range of wavelengths (912 Å ≤ λ ≤ 1 mm) along with the model libraries – optical and infrared. The optical model accounts for stellar emission from galaxies along with dust attenuation as described in Charlot & Fall (2000). The infrared model libraries account purely for dust emission. The interstellar medium (ISM) of the galaxies is described by two components: the ambient (diffuse) ISM and the star-forming region (da Cunha et al. 2011). The combined models and libraries give the full SED of our interacting system at wavelengths from the FUV to the mid-infrared.
We obtained SEDs from ten photometric data points and derived the best-fit models that give the best-fit values of physical parameters – stellar mass (M*), dust mass (Mdust), SFR, dust luminosity (Ldust), and among others. The model libraries were generated by MAGPHYS at redshifts 0.0070 and 0.0075 for analysis, which resulted in an integrated SED. The SEDs are shown in Figure 4 with a total chi-square value of 0.34 and 0.60 and at a redshift of zfit = 0.006969 and 0.007505 for PGC 56121 and PGC 56125, respectively. For the analysis of J15491758 +214951179, we took zfit = 0.006969 as inferred from the H I velocity field in Aguirre et al. (2009). In Figure 4, the chi-square value corresponds mainly to the optical chi-square, as the majority of our photometric points lie at shorter wavelengths, resulting in the fit being constrained predominantly by the optical data.
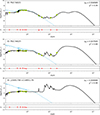 |
Fig. 4. Integrated SED of the system of two galaxies, PGC 56121 (top) and PGC 56125 (middle), and of J15491758 +214951179 (bottom) from FUV to mid-infrared region. In all the figures, the top panel shows the photometric points in green dots from Table 4, and yellow circles are model photometric points at the same wavelength. The black line shows the best-fit model curve across all wavelengths in this regime, and the dashed blue line represents the unattenuated stellar emission. Here, χ2 depicts the total chi-square value of best-fit model and zfit is the redshift of the model used. The bottom panel shows the residuals of the photometric points in red dots along the black dashed line at y = 0. |
The SED modeling provides values of parameters that are important tools for understanding the dynamics and properties of the system. Figure 5 shows the distribution and median values of various parameters along with an uncertainty of ±1σ.
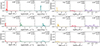 |
Fig. 5. Relative probability distributions of various physical parameters derived from SED fitting. The top row shows the likelihood curves of physical parameters for galaxy PGC 56121, and the middle and bottom rows show those for PGC 56125 and J15491758 +214951179, respectively. The best-fit values and their associated 16th and 84th percentile uncertainties are indicated. |
The μ parameter provides information about the fraction of dust attenuation in the ISM, with its two main components being the ambient (diffuse) ISM and the star-forming clouds. It is given by
 (3)
(3)
Here,  is the effective V-band absorption optical depth of the dust in stellar birth clouds, and
  is the same but in the ambient ISM (da Cunha et al. 2008). This parameter indicates the percentage of dust received from the ambient ISM. For PGC 56121, μ is 0.460; and for PGC 56125, it is 0.866. Models in the system are described with an SFR decaying exponentially as
 (4)
(4)
where γ is the star formation timescale parameter (in gigayear inverse) describing the star formation history (da Cunha et al. 2008). We obtained the values of γ to be 0.086 Gyr−1 for PGC 56121 and 0.842 Gyr−1 for PGC 56125. The onset of star formation was estimated to have occurred approximately 4.5 billion years ago for PGC 56121 and around 6.7 billion years ago for PGC 56125. The metallicity of PGC 56121 was found to be (Z/Z⊙) = 0.022, while that of PGC 56125 was (Z/Z⊙) = 1.906. Other important physical parameters derived from the SED and likelihood distribution function are given in Table 5.
Physical parameters obtained from the SED.
We also performed a g–r color–magnitude analysis of the galaxy PGC 56121 and J15491758 +214951179. The AB magnitude of the SDSS filter used is given by the relation
![Mathematical equation: $$ \begin{aligned} m=22.5-2.5\log _{10}[f] \end{aligned} $$](/articles/aa/full_html/2026/03/aa57341-25/aa57341-25-eq7.gif) (5)
(5)
where “f” is the flux in “nanomaggy” (Abdurro’uf et al. 2022). Using the g and r filters, we obtained the g–r color of PGC 56121 to be ∼0.355. For J15491758 +214951179, we obtained a g–r color of ∼0.041. The g–r color offset between the PGC 56121 and J15491758 +214951179 is ∼0.314.
6. Discussion
Based on existing observational data, we interpret HCG 77 as primarily consisting of a possibly interacting pair, PGC 56121 and PGC 56125, rather than the traditionally assumed four-member system. Although UGC 10049 and PGC 56122 have often been associated with HCG 77 in earlier literature, their redshifts, as reported in archival data and also summarized in Table 1, differ significantly from those of PGC 56121 and PGC 56125. This suggests that they are not physically bound to the group. These findings and our analysis support a more restricted interpretation of HCG 77 as a system dominated by PGC 56121, PGC 56125, and a candidate TDG J15491758 +214951179.
From the constructed SED of the interacting system, we derived several key physical parameters. The estimated stellar masses, SFRs, and physical sizes of the galaxies PGC 56121 and PGC 56125 are broadly consistent with those reported by Amrutha et al. (2024). Based on these parameters, along with morphological features, we classify PGC 56121 as an irregular barred magellanic-type galaxy, and this is supported by the presence of a visually identifiable bar-like structure. In contrast, PGC 56125 exhibits a compact morphology and active star formation, characteristics consistent with being a blue compact dwarf galaxy.
The dust attenuation parameter μ of PGC 56121 is found to be 0.46, implying that about 46% of the dust emission comes from the ambient ISM. This suggests a significant contribution from birth clouds and a relatively younger stellar population in PGC 56121 than in PGC 56125, whose μ is 0.86.
For PGC 56121, the star formation timescale parameter γ = 0.086 Gyr−1 indicates that the SFR is slowly declining over time, which is consistent with a system experiencing sustained star-forming activity. For PGC 56125, γ is 0.842 Gyr−1, indicating that the star formation activity is declining and the galaxy may be heading toward quenching. The estimated metallicity of PGC 56121 is 0.022 times the solar value, pointing to a metal-poor environment with a high gas fraction. The recognition that such galaxies can simultaneously exhibit low metallicity and high SFRs originates from the studies of Searle & Sargent (1972), as referenced in Kunth & Östlin (2000). The metallicity of PGC 56125 is 1.906 Z⊙, indicating a metal-rich galaxy.
Located at the tip of the tidal tail of PGC 56121, J15491758 +214951179 exhibits properties indicative of a possible TDG. We obtained a g–r color of ∼0.355 for PGC 56121 and ∼0.041 for J15491758 +214951179, and the resulting color offset is ∼0.314. This significant difference suggests a younger stellar population in the tidal feature. Additionally, the stellar mass of J15491758 +214951179 is 6.02 × 10⁶ M⊙, which is less than 10% of the stellar mass of the parent galaxy, and it is consistent with the expectations for tidal dwarfs candidates, as these findings align with the statistical criteria outlined in Kaviraj et al. (2011) to identify TDGs. The findings also match the observations and results stated in Zaragoza-Cardiel et al. (2024). The most extended feature within this tidally influenced region measures roughly 0.9 kpc.
The SED fitting for the TDG candidate was performed using only optical photometric data, as infrared measurements were not available for this region. The absence of mid- and far-infrared fluxes may lead to an underestimation of the total stellar mass and dust content. Consequently, the derived stellar mass should be considered as an indicative value rather than a precise measurement. However, even within this limitation, the estimated stellar mass (M* ∼ 106 M⊙) remains consistent with the mass range typically observed for TDGs. Moreover, even if the true stellar mass were higher by up to an order of magnitude, it would still lie within the broad range reported for TDG candidates in the literature, thus supporting the classification of this object as a TDG candidate.
The star-forming regions R8 to R10 in Figure 3 are relatively faint in comparison to R6 and R7, which trace the central barred part of the galaxy, and the photometric data available for them were insufficient to reliably construct their SEDs. Looking at their structural alignment, we interpret regions R8 to R10 as being part of the extended outer arm of PGC 56121. In addition, regions T1–T3 might correspond to gas streams or be a part of an outer arm of star-forming regions in PGC 56121 going in the northwest direction. However, more data, deeper multiwavelength imaging, or spectroscopy are needed to better understand the nature of these regions and to confirm their physical association with the parent galaxy.
Multiple indicators suggest that the five galaxies – UGC 10043, MCG+04-37-035, LEDA 1656651 (also referred as J1592443+215115), and the HCG 77 system (PGC 56121 and PGC 56125) are engaged in mutual interactions and may collectively constitute a galaxy group. Archival Very Large Array (VLA) radio data show clear evidence of UGC 10043, the most massive galaxy among them, drawing gas from MCG+04-37-035, which is consistent with tidal interactions (Matthews & de Grijs 2004). Furthermore, velocity contour maps reveal an asymmetric distribution of neutral hydrogen around HCG 77 and a trail of HI material extending from LEDA 1656651 to UGC 10043, reinforcing the case for ongoing interactions (Aguirre et al. 2009).
In terms of projected separations, the distances among these objects lie between ∼0.33 Mpc and ∼3.5 Mpc. These spatial proximities, along with the observed signs of interaction, also suggest that these galaxies may constitute a small dynamically connected group. The morphological distortions observed in the HCG 77 system, particularly in PGC 56121 and PGC 56125, may be attributed to past or ongoing gravitational interactions with these galaxies, which together comprise a larger-scale group. The SFRs on the order of 10−2 M⊙ yr−1 observed in our dwarf galaxies, with stellar masses in the range 107 − 108 M⊙, are consistent with values typically found in star-forming dwarf systems.
The dwarfs in our study lie in proximity to a larger barred spiral galaxy, which suggests that tidal perturbations from the massive companion may be influencing their evolution. Previous observational work has shown that dwarfs located near massive spirals often display enhanced star formation, tidal disturbances, and morphological asymmetries consistent with interaction-driven activity (Lelli et al. 2014). The star formation we measured is therefore plausibly linked to external tidal effects rather than purely internal processes, highlighting the important role of galaxy environment in regulating the growth and star-forming properties of dwarfs. These observations suggest the presence of an evolving group structure influencing the dynamics and star formation activity.
7. Summary
We have presented a high resolution FUV image of galaxies in and around the group HCG 77, using UVIT on board AstroSat. While HCG 77 has traditionally been considered a four-member group, existing redshift data, previous classifications, and the analysis presented in this study indicate that it is more accurately described as a system consisting of PGC 56121, PGC 56125, and J15491758 +214951179 (TDG). The first two galaxies are at redshifts of 0.006969 and 0.007505, respectively, whereas the accurate redshift of the TDG is still unknown. We respectively classify PGC 56121 and PGC 56125 as an irregular barred magellanic galaxy and a blue compact dwarf based on their compact sizes, their low stellar masses, and the SFRs derived in this study. The classifications are also supported by the morphological appearance of the galaxies.
We report the presence of a possible TDG at the end of the tidal tail of the parent galaxy PGC 56121, identified as J15491758 +214951179. This source merits further study across multiple wavelengths, and accurate redshift measurement is required. The physical extent of these galaxies is approximately 1 kpc. Other galaxies within the field of view are significantly larger compared to PGC 56121 and PGC 56125. The edge-on barred spiral galaxy UGC 10043 is the largest in the field of view, with a diameter of 21.36 kpc. Additional signs of interaction with nearby galaxies, such as UGC 10043 and LEDA 1656651, suggest that HCG 77 may be part of a more extended group that may be influencing its morphological and dynamical evolution.
We have identified several detailed structures and 16 distinct star-forming regions in the system using the high-resolution images. The photometry of these regions within the system was carried out, and their fluxes, luminosities, and sizes were derived. We carried out SED modeling to determine the physical properties of PGC 56121 and PGC 56125. Notably, PGC 56121 exhibits a higher stellar mass but a lower SFR and metallicity compared to PGC 56125. In contrast, PGC 56125 shows enhanced star formation activity and a more chemically enriched environment, indicating distinct evolutionary stages between the two galaxies.
Data availability
L1 raw data from observations used in this paper are available at the AstroSat archives of ISRO maintained by ISSDC7. The final processed FUV image used for the analysis in this paper is available at the CDS via https://cdsarc.cds.unistra.fr/viz-bin/cat/J/A+A/707/A248.
Acknowledgments
We gratefully acknowledge the use of data from the Ultra-Violet Imaging Telescope (UVIT) on board the AstroSat mission, an effort of the Indian Space Research Organisation (ISRO). The UVIT data used in this study were obtained through the data archive at the Indian Space Science Data Center (ISSDC). This research has used data from the NASA/IPAC Extragalactic Database (NED), which is funded by NASA and operated by the California Institute of Technology. This research has also used the Set of Identifications, Measurements, and Bibliographies for Astronomical Data (SIMBAD), which is maintained by the Centre de données astronomiques de Strasbourg (CDS). The authors acknowledge the use of data from the Sloan Digital Sky Survey (SDSS). Funding for SDSS has been provided by the Alfred P. Sloan Foundation, the Participating Institutions, the National Science Foundation, and the U.S. Department of Energy Office of Science. This research has also used the Mikulski Archive for Space Telescopes (MAST). MAST is a NASA-funded archive maintained by the Space Telescope Science Institute (STScI), operated by the Association of Universities for Research in Astronomy, Inc., under NASA contract NAS 5–26555. This publication also used data products from the Wide field Infrared Survey Explorer (WISE), which is a joint project of the University of California, Los Angeles, and the Jet Propulsion Laboratory/California Institute of Technology, funded by the National Aeronautics and Space Administration. K. P. Singh thanks the Indian National Science Academy for support under the Senior Scientist Programme. We thank Abhinna Sundar and Chavan Shende for their valuable contribution to this research work.
References
- Abdurro’uf, Accetta, K., Aerts, C., et al. 2022, ApJS, 259, 35 [NASA ADS] [CrossRef] [Google Scholar]
- Aguirre, P., Uson, J. M., & Matthews, L. D. 2009, Rev. Mex. Astron. Astrofis. Conf. Ser., 35, 201 [Google Scholar]
- Ahumada, R., Prieto, C. A., Almeida, A., et al. 2020, ApJS, 249, 3 [Google Scholar]
- Albareti, F. D., Allende Prieto, C., Almeida, A., et al. 2017, ApJS, 233, 25 [Google Scholar]
- Amrutha, S., Das, M., & Yadav, J. 2024, MNRAS, 530, 2199 [NASA ADS] [CrossRef] [Google Scholar]
- Bahr, S. K. H., & Mosenkov, A. V. 2025, A&A, 698, L21 [NASA ADS] [CrossRef] [EDP Sciences] [Google Scholar]
- Barnes, J. E., & Hernquist, L. 1992, ARA&A, 30, 705 [Google Scholar]
- Bertin, E., & Arnouts, S. 1996, A&AS, 117, 393 [NASA ADS] [CrossRef] [EDP Sciences] [Google Scholar]
- Bianchi, L. 2011, Ap&SS, 335, 51 [Google Scholar]
- Charlot, S., & Fall, S. M. 2000, ApJ, 539, 718 [Google Scholar]
- da Cunha, E., Charlot, S., & Elbaz, D. 2008, MNRAS, 388, 1595 [Google Scholar]
- da Cunha, E., Charlot, S., Dunne, L., Smith, D., & Rowlands, K. 2011, Proc. Int. Astron. Union, 7, 292 [NASA ADS] [CrossRef] [Google Scholar]
- de Vaucouleurs, G., de Vaucouleurs, A., Corwin, H. G., Jr, et al. 1991, Third Reference Catalogue of Bright Galaxies (New York, NY: Springer) [Google Scholar]
- Helou, G., Madore, B. F., Schmitz, M., et al. 1991, in Databases and On-line Data in Astronomy, eds. M. A. Albrecht, & D. Egret, ASSL, 171, 89 [NASA ADS] [CrossRef] [Google Scholar]
- Hernquist, L. 1989, Nature, 340, 687 [Google Scholar]
- Hickson, P. 1982, ApJ, 255, 382 [NASA ADS] [CrossRef] [Google Scholar]
- Hickson, P. 1993, ApLC, 29, 1 [Google Scholar]
- Hickson, P., Mendes de Oliveira, C., Huchra, J. P., & Palumbo, G. G. 1992, ApJ, 399, 353 [Google Scholar]
- Hopkins, P. F., Hernquist, L., Cox, T. J., et al. 2006, ApJS, 163, 1 [Google Scholar]
- Hopkins, P. F., Hernquist, L., Cox, T. J., & Kereš, D. 2008, ApJS, 175, 356 [Google Scholar]
- Iglesias-Paramo, J., Buat, V., Takeuchi, T., et al. 2006, ApJS, 164, 38 [CrossRef] [Google Scholar]
- Jönsson, H., Holtzman, J. A., Allende Prieto, C., et al. 2020, AJ, 160, 120 [Google Scholar]
- Joye, W. A., & Mandel, E. 2003, in Astronomical Data Analysis Software and Systems XII, eds. H. E. Payne, R. I. Jedrzejewski, & R. N. Hook, ASPCS, 295, 489 [NASA ADS] [Google Scholar]
- Kaviraj, S., Darg, D., Lintott, C., Schawinski, K., & Silk, J. 2011, MNRAS, 419, 70 [Google Scholar]
- Kormendy, J., & Ho, L. C. 2013, ARA&A, 51, 511 [Google Scholar]
- Kunth, D., & Östlin, G. 2000, A&A Rev., 10, 1 [NASA ADS] [CrossRef] [Google Scholar]
- Lelli, F., Verheijen, M., & Fraternali, F. 2014, MNRAS, 445, 1694 [Google Scholar]
- Mahajan, S., Singh, K. P., Postma, J. E., et al. 2022, PASA, 39, 1 [Google Scholar]
- Martin, G., Jackson, R. A., Kaviraj, S., et al. 2020, MNRAS, 500, 4937 [NASA ADS] [CrossRef] [Google Scholar]
- Matthews, L. D., & de Grijs, R. 2004, AJ, 128, 137 [Google Scholar]
- McIntosh, D. H., Guo, Y., Hertzberg, J., et al. 2008, MNRAS, 388, 1537 [NASA ADS] [CrossRef] [Google Scholar]
- Mihos, J. C., & Hernquist, L. 1996, ApJ, 464, 641 [Google Scholar]
- Postma, J. E., & Leahy, D. 2021, JAA, 42, 30 [Google Scholar]
- Samantaray, A. S., Jassal, H. K., Singh, K. P., & Dewangan, G. C. 2024, A&A, 686, A241 [NASA ADS] [CrossRef] [EDP Sciences] [Google Scholar]
- Schlafly, E. F., & Finkbeiner, D. P. 2011, ApJ, 737, 103 [Google Scholar]
- Searle, L., & Sargent, W. L. W. 1972, ApJ, 173, 25 [NASA ADS] [CrossRef] [Google Scholar]
- Singh, K. P., Tandon, S. N., Agrawal, P. C., et al. 2014, in Space Telescopes and Instrumentation 2014: Ultraviolet to Gamma Ray, eds. T. Takahashi, J. W. A. den Herder, & M. Bautz, SPIE Conf. Ser., 9144, 91441S [NASA ADS] [Google Scholar]
- Springob, C. M., Haynes, M. P., Giovanelli, R., & Kent, B. R. 2005, ApJS, 160, 149 [NASA ADS] [CrossRef] [Google Scholar]
- Stierwalt, S., Besla, G., Patton, D., et al. 2015, ApJ, 805, 2 [NASA ADS] [CrossRef] [Google Scholar]
- Subramanian, S., Mondal, C., & Kalari, V. 2024, A&A, 681, A8 [Google Scholar]
- Tandon, S. N., Subramaniam, A., Girish, V., et al. 2017, AJ, 154, 128 [NASA ADS] [CrossRef] [Google Scholar]
- Tandon, S. N., Postma, J., Joseph, P., et al. 2020, AJ, 159, 158 [Google Scholar]
- Toomre, A., & Toomre, J. 1972, ApJ, 178, 623 [Google Scholar]
- Wenger, M., Ochsenbein, F., Egret, D., et al. 2000, A&ASS, 143, 9 [NASA ADS] [CrossRef] [EDP Sciences] [Google Scholar]
- Zaragoza-Cardiel, J., Smith, B. J., Jones, M. G., et al. 2024, A&A, 689, A206 [NASA ADS] [CrossRef] [EDP Sciences] [Google Scholar]
ISSDC Data archive: https://astrobrowse.issdc.gov.in/astro_archive/archive/Home.jsp
Conversion factors for different filters are available at https://www.iiap.res.in/projects/uvit/instrument/filters/
All Tables
Photometric observations used in the SED fitting for PGC 56121, PGC 56125, and J15491758 +214951179.
All Figures
|
Fig. 1. Far-UV images of galaxies in the field of view of the UVIT telescope while observing the HCG 77 region. |
| In the text | |
|
Fig. 2. Surface brightness contour map of three sources : PGC 56121, PGC 56125, and J15491758 +214951179. Left: The contour levels plotted are 4σ, 5σ, 7σ, 11σ, 16σ, 22σ, 34σ, and 55σ above the background level on far-UV image. Regions highlighted in pink represent areas of higher flux density and are likely associated with active star-forming regions, while the green shaded areas denote more diffuse emission, possibly due to gas with lower luminosity. Objects analyzed in this study are outlined by white dashed regions. Right: Contours derived from the FUV data overlaid on the SDSS r-band image for a comparison and to identify star-forming and brighter regions. |
| In the text | |
|
Fig. 3. Star-forming regions identified within the diffuse gas of the system. Regions R1–R13 mark the star-forming sites detected through photometry. Background regions B1 and B2 were selected to estimate the background counts. Regions T1-T3 represent a gas trail that is also associated with star formation. |
| In the text | |
|
Fig. 4. Integrated SED of the system of two galaxies, PGC 56121 (top) and PGC 56125 (middle), and of J15491758 +214951179 (bottom) from FUV to mid-infrared region. In all the figures, the top panel shows the photometric points in green dots from Table 4, and yellow circles are model photometric points at the same wavelength. The black line shows the best-fit model curve across all wavelengths in this regime, and the dashed blue line represents the unattenuated stellar emission. Here, χ2 depicts the total chi-square value of best-fit model and zfit is the redshift of the model used. The bottom panel shows the residuals of the photometric points in red dots along the black dashed line at y = 0. |
| In the text | |
|
Fig. 5. Relative probability distributions of various physical parameters derived from SED fitting. The top row shows the likelihood curves of physical parameters for galaxy PGC 56121, and the middle and bottom rows show those for PGC 56125 and J15491758 +214951179, respectively. The best-fit values and their associated 16th and 84th percentile uncertainties are indicated. |
| In the text | |
Current usage metrics show cumulative count of Article Views (full-text article views including HTML views, PDF and ePub downloads, according to the available data) and Abstracts Views on Vision4Press platform.
Data correspond to usage on the plateform after 2015. The current usage metrics is available 48-96 hours after online publication and is updated daily on week days.
Initial download of the metrics may take a while.