Fig. 4.
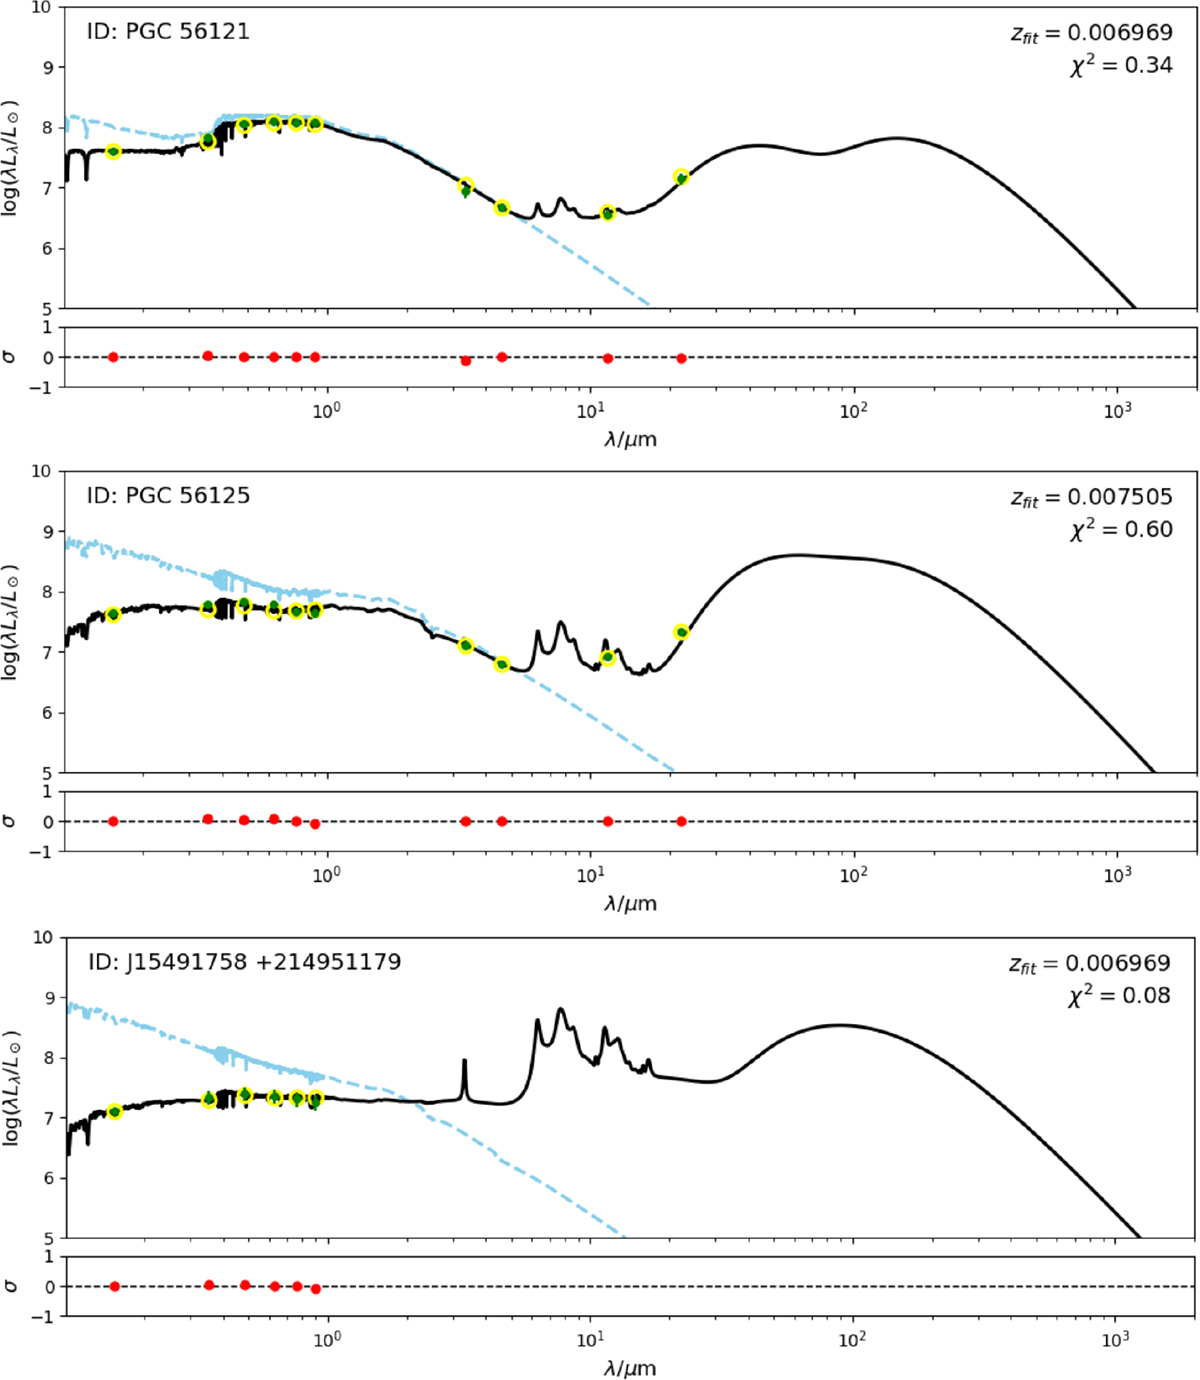
Download original image
Integrated SED of the system of two galaxies, PGC 56121 (top) and PGC 56125 (middle), and of J15491758 +214951179 (bottom) from FUV to mid-infrared region. In all the figures, the top panel shows the photometric points in green dots from Table 4, and yellow circles are model photometric points at the same wavelength. The black line shows the best-fit model curve across all wavelengths in this regime, and the dashed blue line represents the unattenuated stellar emission. Here, χ2 depicts the total chi-square value of best-fit model and zfit is the redshift of the model used. The bottom panel shows the residuals of the photometric points in red dots along the black dashed line at y = 0.
Current usage metrics show cumulative count of Article Views (full-text article views including HTML views, PDF and ePub downloads, according to the available data) and Abstracts Views on Vision4Press platform.
Data correspond to usage on the plateform after 2015. The current usage metrics is available 48-96 hours after online publication and is updated daily on week days.
Initial download of the metrics may take a while.