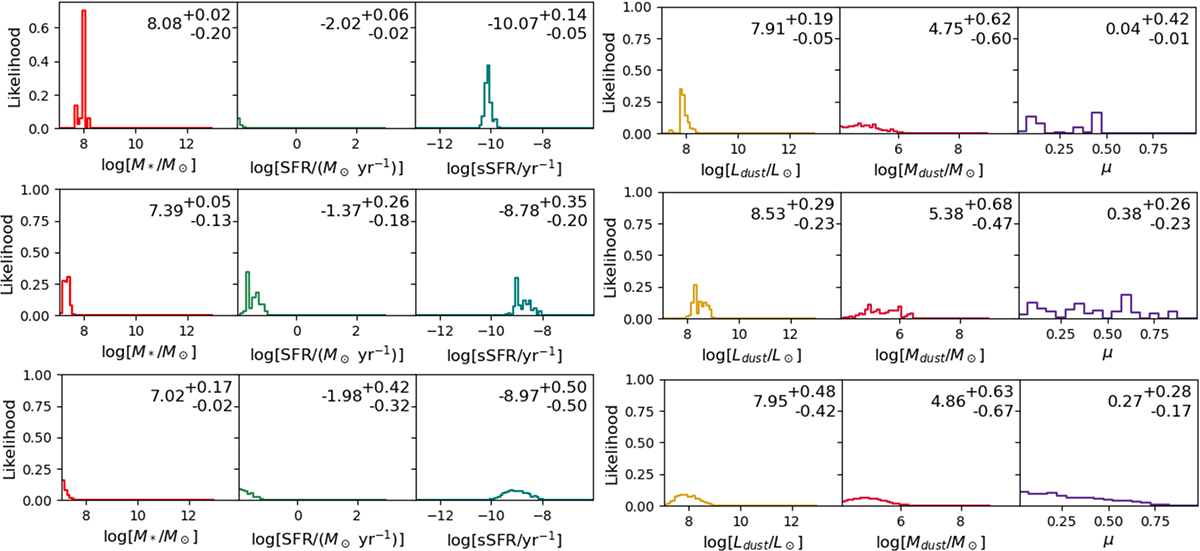
Fig. 5.
Download original image
Relative probability distributions of various physical parameters derived from SED fitting. The top row shows the likelihood curves of physical parameters for galaxy PGC 56121, and the middle and bottom rows show those for PGC 56125 and J15491758 +214951179, respectively. The best-fit values and their associated 16th and 84th percentile uncertainties are indicated.
Current usage metrics show cumulative count of Article Views (full-text article views including HTML views, PDF and ePub downloads, according to the available data) and Abstracts Views on Vision4Press platform.
Data correspond to usage on the plateform after 2015. The current usage metrics is available 48-96 hours after online publication and is updated daily on week days.
Initial download of the metrics may take a while.