Open Access
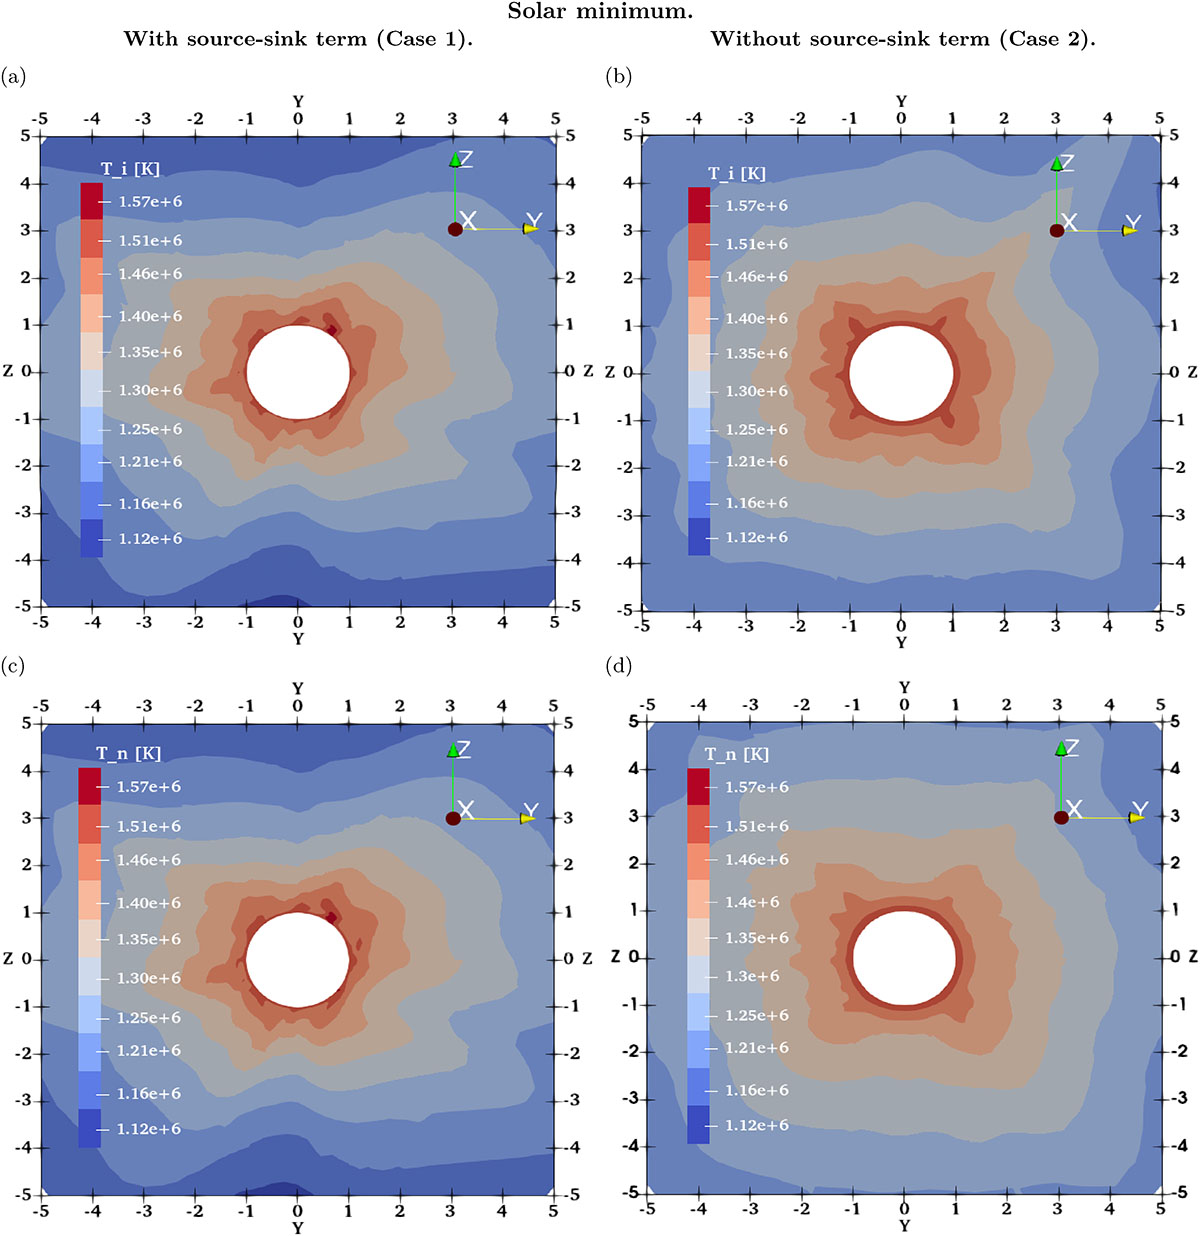
Fig. 4.
Download original image
Contour plot of log Ti (a, b) and log Tn (c, d), with (a, c) and without (b, d) source-sink term. All temperatures are expressed in kelvin (K). These plots correspond to the solar-minimum case.
Current usage metrics show cumulative count of Article Views (full-text article views including HTML views, PDF and ePub downloads, according to the available data) and Abstracts Views on Vision4Press platform.
Data correspond to usage on the plateform after 2015. The current usage metrics is available 48-96 hours after online publication and is updated daily on week days.
Initial download of the metrics may take a while.