Open Access
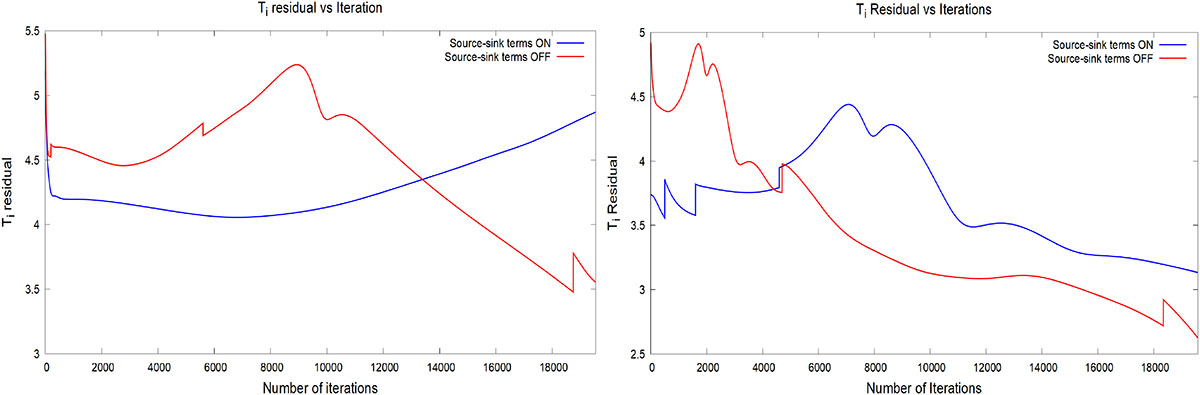
Fig. 9.
Download original image
Variation of Ti residual with iteration count in the numerical simulation for the solar minimum (a) and solar maximum (b). The blue curve belongs to Case 1 (with source-sink term), whereas the red curve corresponds to Case 2 (without source-sink term).
Current usage metrics show cumulative count of Article Views (full-text article views including HTML views, PDF and ePub downloads, according to the available data) and Abstracts Views on Vision4Press platform.
Data correspond to usage on the plateform after 2015. The current usage metrics is available 48-96 hours after online publication and is updated daily on week days.
Initial download of the metrics may take a while.