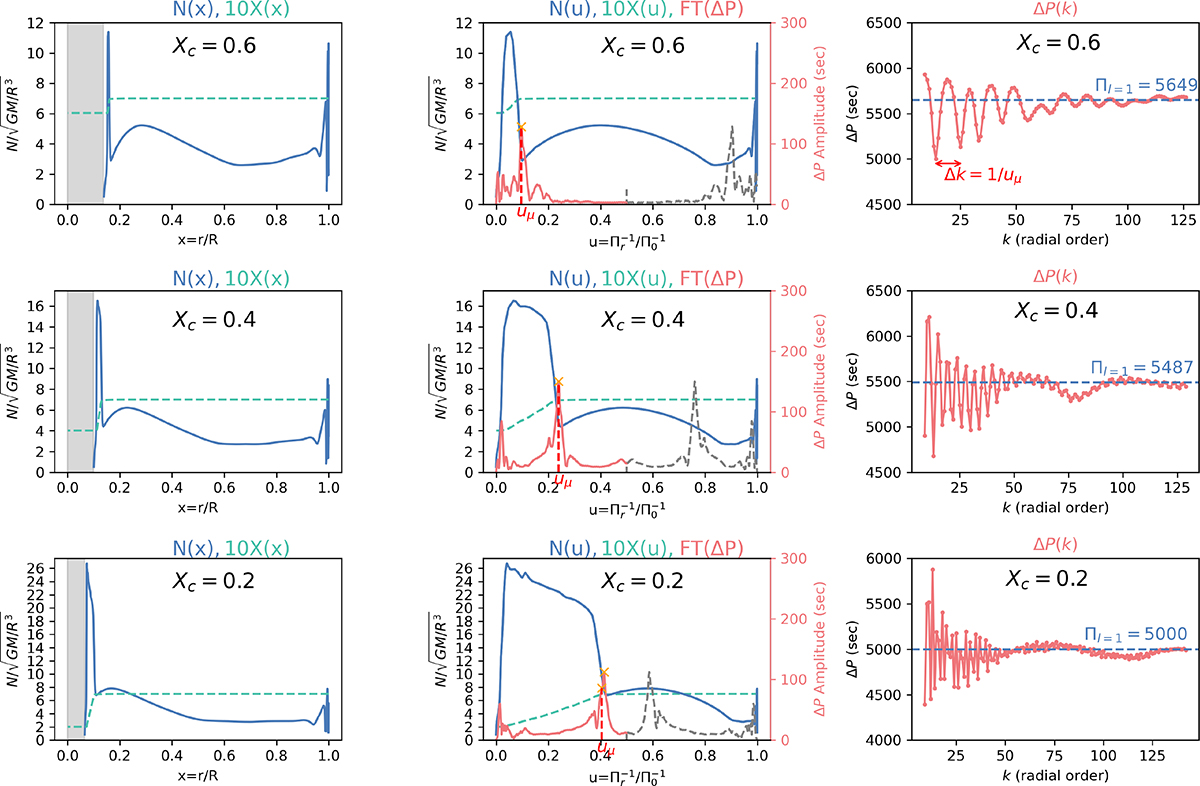
Fig. 1.
Download original image
Brunt–Väisälä (buoyancy) profiles, period spacings and their Fourier spectra for an M = 3.2 M⊙ MESA stellar model. Profiles are plotted as a function of the radial coordinate x = r/R (left panels) and the buoyancy coordinate, u (middle panels), with solar metallicity and convective overshooting, fov = 0.015. The hydrogen mass fraction, X, is shown by dashed green lines (multiplied by 10 for clarity). The gray-shaded regions denote the receding convective core. The dipole gravity-mode period spacings, ΔPk, are shown in the right panels, and their Fourier amplitude spectra, FT(ΔP), are overplotted in the middle panels (red lines, with super-Nyquist components in gray). The dominant Fourier-spectrum peak aligns with the sharp drop points of the Brunt profile and is labeled as uμ in red.
Current usage metrics show cumulative count of Article Views (full-text article views including HTML views, PDF and ePub downloads, according to the available data) and Abstracts Views on Vision4Press platform.
Data correspond to usage on the plateform after 2015. The current usage metrics is available 48-96 hours after online publication and is updated daily on week days.
Initial download of the metrics may take a while.