Fig. 3.
Download original image
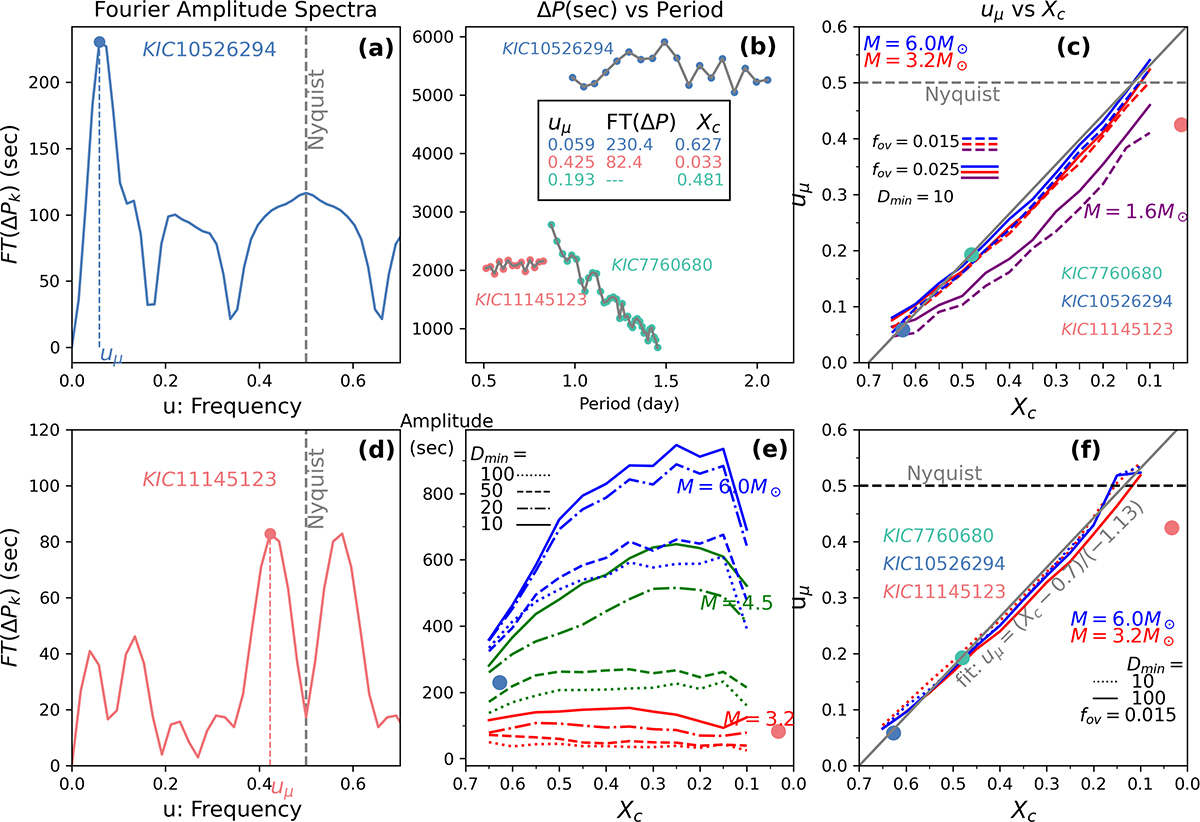
Panel (b): Observed g-mode period spacings ΔP and periods for KIC 10526294, KIC 11145123, KIC 7760680. The Fourier spectra of KIC 10526294 and KIC 11145123 are shown in panel (a) and (d), respectively. The dominant peaks are labeled by the filled circles with the corresponding frequency, uμ. Panel (c) and (f): The g-mode ΔP variational frequency, uμ, is plotted as a function of central hydrogen mass fraction, Xc, for MESA models of masses M = 6.0 (blue), 3.2 (red) and 1.6 M⊙ (purple); (c) shows models with different convective-core overshooting, fov, and (f) displays the effect of the envelope mixing, Dmin. Panel (e) illustrates the amplitudes of FT(ΔP) for MESA models with different masses and Dmin.
Current usage metrics show cumulative count of Article Views (full-text article views including HTML views, PDF and ePub downloads, according to the available data) and Abstracts Views on Vision4Press platform.
Data correspond to usage on the plateform after 2015. The current usage metrics is available 48-96 hours after online publication and is updated daily on week days.
Initial download of the metrics may take a while.