Fig. 2
Download original image
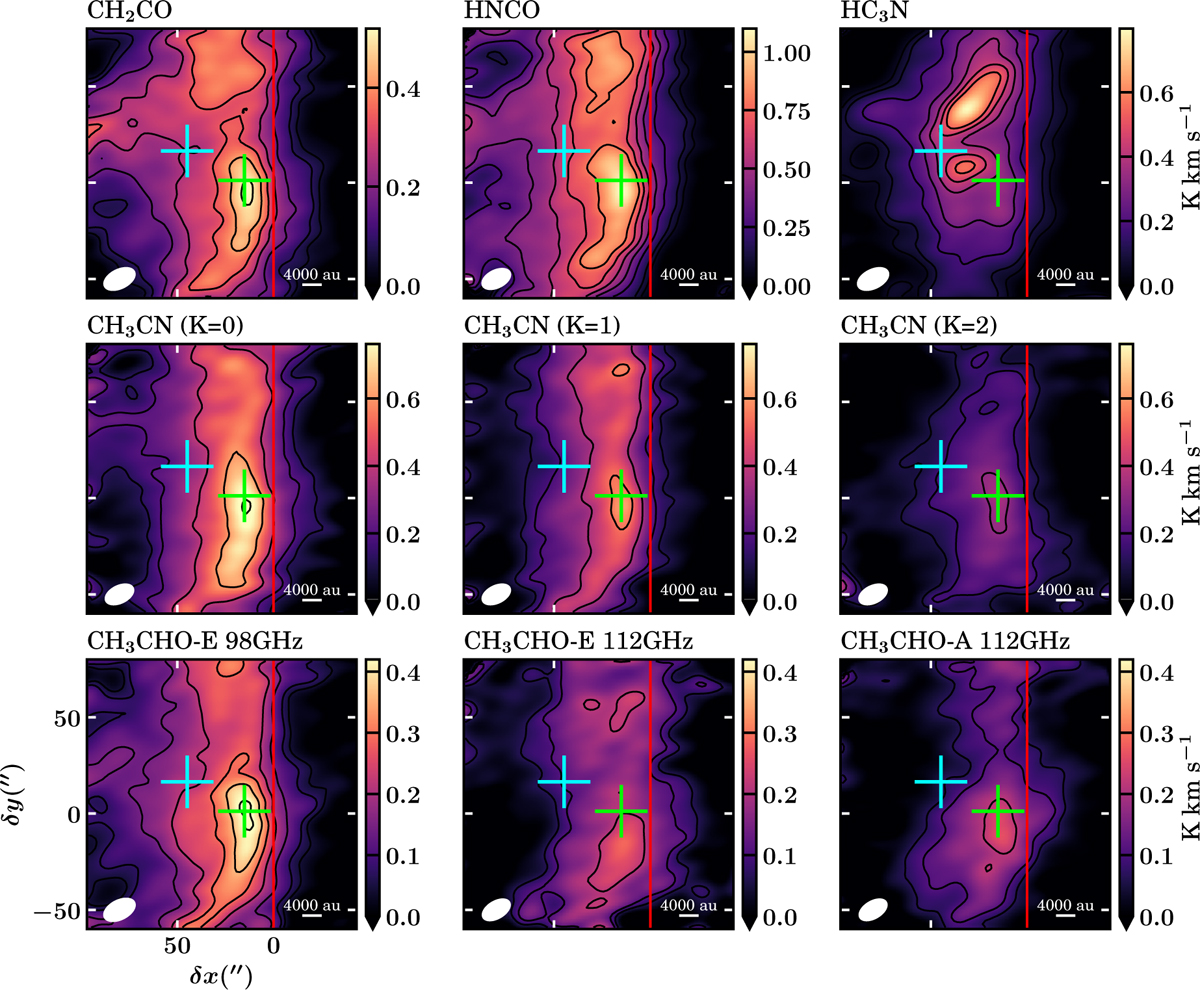
Zeroth-moment maps gallery for different molecular species moderately resolved at the Horsehead edge. The maps have been rotated 14° counterclockwise to bring the illuminating star direction in the horizontal direction. The contours are [3, 5, 10, 15, 20, 25, 30] × σ, where σ is the zeroth-moment rms listed in Table 1. The red vertical line represents the horizontal zero, delineating the PDR edge (Pety et al. 2005), whereas the cyan and green crosses show the dense core (Pety et al. 2007) and PDR (Gerin et al. 2009) positions, respectively. The beam size and a scale bar indicating 4000 au are shown in the bottom left and bottom right corner, respectively, of each panel. Transitions corresponding to the same molecular species are shown using the same color-scale range.
Current usage metrics show cumulative count of Article Views (full-text article views including HTML views, PDF and ePub downloads, according to the available data) and Abstracts Views on Vision4Press platform.
Data correspond to usage on the plateform after 2015. The current usage metrics is available 48-96 hours after online publication and is updated daily on week days.
Initial download of the metrics may take a while.