| Issue |
A&A
Volume 707, March 2026
|
|
|---|---|---|
| Article Number | A120 | |
| Number of page(s) | 21 | |
| Section | Interstellar and circumstellar matter | |
| DOI | https://doi.org/10.1051/0004-6361/202557383 | |
| Published online | 10 March 2026 | |
Spatial distribution of organics in the Horsehead nebula: Signposts of chemistry driven by atomic carbon
1
Instituto de Astrofísica, Pontificia Universidad Católica de Chile,
Av. Vicuña Mackenna 4860,
7820436
Macul, Santiago,
Chile
2
Millennium Nucleus on Young Exoplanets and their Moons (YEMS),
Chile
3
European Southern Observatory,
Alonso de Córdova 3107, Casilla 19, Vitacura,
Santiago,
Chile
4
IRAM,
300 rue de la Piscine,
38400
Saint Martin d’Hères,
France
5
LUX, Observatoire de Paris, PSL Research University, CNRS, Sorbonne Universités,
75014
Paris,
France
6
Theoretical Astrophysics, Department of Physics and Astronomy, Uppsala University,
Box 516,
75120
Uppsala,
Sweden
7
Instituto de Física Fundamental (CSIC),
Calle Serrano 121,
28006,
Madrid,
Spain
8
LUX, Observatoire de Paris, PSL Research University, CNRS, Sorbonne Universités,
92190
Meudon,
France
9
Joint ALMA Observatory,
Avenida Alonso de Córdova 3107, Vitacura,
Santiago,
Chile
10
Laboratoire d’Astrophysique de Bordeaux, Univ. Bordeaux, CNRS,
B18N, Allée Geoffroy Saint-Hilaire,
33615
Pessac,
France
★ Corresponding author: This email address is being protected from spambots. You need JavaScript enabled to view it.
Received:
23
September
2025
Accepted:
27
January
2026
Abstract
Complex organic molecules (COMs) are considered essential precursors to prebiotic species in the interstellar and circumstellar medium. Despite their astrobiological relevance, many aspects of the formation of COMs remain unclear, particularly the role of ultraviolet (UV) radiation. While COMs were once expected to be efficiently destroyed under UV-irradiated conditions, detections in photodissociation regions (PDRs) have challenged this view. However, the mechanisms by which UV radiation contributes to their formation are still uncertain. Here we present moderately resolved maps of simple and complex organic molecules at the UV-illuminated edge of the Horsehead nebula, obtained by combining Atacama Large Millimeter/submillimeter Array (ALMA) and IRAM 30 m single-dish observations at ~15″ resolution. For the first time in this PDR environment, we analyzed the spatial distribution of species such as C17O, CH2CO, CH3CHO, HNCO, CH3CN, and HC3N. By incorporating previous C17O and C18O single-dish data as well as Plateau de Bure Interferometer (PdBI) maps of H2CO and CH3OH, we derived profiles of gas density, temperature, thermal pressure, and column densities of the organic species as a function of distance from the UV source. Our results show that most organic species – particularly H2CO, CH2CO, CH3CHO, HNCO, and CH3CN – exhibit enhanced column densities at the UV-illuminated edge compared to cloud interiors, possibly indicating efficient dust-grain surface chemistry driven by the diffusion of atomic C and radicals produced via photodissociation of CO and CH3OH, as supported by recent laboratory experiments. The exceptions, HC3N and CH3OH, can be attributed to inefficient formation on dust grains and ineffective nonthermal desorption into the gas phase, respectively. Additionally, contributions from gas-phase hydrocarbon photochemistry, possibly seeded by grain-surface products, cannot be ruled out. Further chemical modeling is needed to confirm the efficiency of these pathways for the studied species, which could have important implications for other cold UV-irradiated environments such as protoplanetary disks.
Key words: astrochemistry / ISM: clouds / ISM: molecules / photon-dominated region (PDR)
© The Authors 2026
 Open Access article, published by EDP Sciences, under the terms of the Creative Commons Attribution License (https://creativecommons.org/licenses/by/4.0), which permits unrestricted use, distribution, and reproduction in any medium, provided the original work is properly cited.
This article is published in open access under the Subscribe to Open model. This email address is being protected from spambots. You need JavaScript enabled to view it. to support open access publication.
1 Introduction
Molecular line observations provide a powerful tool for probing the structure and physical conditions of the molecular gas across a wide range of environments, from high-redshift galaxies (Carilli & Walter 2013) to protoplanetary disks (Öberg et al. 2023). To date, about 330 molecules have been detected in the interstellar medium (ISM) and in circumstellar shells1. While most detections involve simple diatomic or triatomic species, a significant subset consists of organic molecules with six or more atoms, loosely defined as complex organic molecules (COMs; Herbst & van Dishoeck 2009).
The study of COMs and their precursors is critical not only because they trace the physical and chemical evolution across different stages of star and planet formation, but also because they are potential precursors of prebiotic species, the building blocks of terrestrial life (Ceccarelli et al. 2023). Fundamental compounds such as amino acids and nucleotide bases are believed to have an interstellar origin (Garrod 2013; Altwegg et al. 2016; Jiménez-Serra et al. 2020; Rivilla et al. 2019, 2023), though their formation pathways remain uncertain. Therefore, dedicated studies of the formation mechanisms of simpler COMs are essential to clarify their role in producing the ingredients necessary for life as we know it.
The origin of COMs remains an active area of investigation in astrochemistry. Traditionally, COMs have been abundantly detected in hot cores around high-mass protostars (e.g., Bisschop et al. 2007; Feng et al. 2015; Bonfand et al. 2017; van der Walt et al. 2021) and in their low-mass counterparts, hot corinos (e.g., Cazaux et al. 2003; Öberg et al. 2014; Belloche et al. 2020; Yang et al. 2021). Their formation was typically attributed to small organics produced via grain-surface reactions from inherited ices, which are then thermally desorbed and processed further through gas-phase chemistry (Herbst & van Dishoeck 2009). However, the detection of abundant COMs in pre-stellar cores has challenged this view (e.g., Bacmann et al. 2012; Cernicharo et al. 2012; Jiménez-Serra et al. 2016; Scibelli et al. 2024), highlighting the possible importance of cold gas-phase reactions (Shannon et al. 2013), nondiffusive chemistry on grains (Jin & Garrod 2020; Garrod et al. 2022), and nonthermal desorption processes such as chemical desorption (Garrod et al. 2007).
Thus, there is general consensus that the observed abundances of COMs likely arise from an intricate interaction between gas-phase and grain-surface chemistry (Jørgensen et al. 2020; Ceccarelli et al. 2023), though many aspects remain poorly understood. In particular, the role of ultraviolet (UV) radiation is crucial as it can further process interstellar ices and promote their release into the gas phase through nonthermal photodesorption (Öberg 2016). Moreover, laboratory experiments demonstrate that UV irradiation of ices can even lead to the formation of prebiotic species (de Marcellus et al. 2015; Oba et al. 2019). These processes are especially relevant in environments such as protoplanetary disks, where compelling evidence for in situ ice processing has recently been proposed (e.g., Walsh et al. 2016; Calahan et al. 2023; Ligterink et al. 2024; Yamato et al. 2024; Evans et al. 2025). However, the generally low abundance of COMs and the complex physicochemical structure of these environments (see Öberg et al. 2023, for a recent review) make their study especially challenging.
A promising way to investigate the impact of UV radiation on COM chemistry is to study the edges of molecular clouds illuminated by massive stars, known as the photodissociation regions (PDRs; Hollenbach & Tielens 1999). In these environments, far-UV (FUV; 6 < hv < 13.6 eV) photons dominate the chemistry and were initially thought to efficiently photodissociate large molecules. However, more recent studies have challenged this view (see Wolfire et al. 2022, for a recent review). Particularly, COMs have been observed to be abundant in PDRs (e.g., Guzmán et al. 2014; Cuadrado et al. 2017), even when the radiation field exceeds the interstellar average by several orders of magnitude (G0 ~ 102−104, where G0 = 1.7 is the average interstellar radiation field; Draine 1978). Pure gas-phase models cannot account for the observed high COM abundances in these regions (e.g., Gratier et al. 2013; Guzmán et al. 2013; Cuadrado et al. 2017), pointing to a key role for FUV processing of ices. However, the details of this chemistry remain poorly constrained observationally: only a handful of targeted studies exist (e.g., Guzmán et al. 2014; Cuadrado et al. 2017), all relying on single-dish telescopes, and thus lacking spatial resolution to determine how COMs are distributed relative to the UV source.
Illuminated by the 09.5 V binary system σ Orionis (Warren & Hesser 1977) ~3.5 pc away from the molecular cloud (Abergel et al. 2003), the PDR located at the edge of the Horsehead nebula is particularly well-suited for a spatially resolved study. Thanks to its proximity (~400 pc, Anthony-Twarog 1982), nearly edge-on geometry, and moderate radiation field (G0 ~ 100, Habart et al. 2005), the Horsehead PDR is an archetype for the average UV radiation fields in molecular clouds of the Milky Way and normal star-forming galaxies. As a consequence, its gas and dust content have been thoroughly characterized at different wavelengths (Schirmer et al. 2020; Hernández-Vera et al. 2023; Abergel et al. 2024, and references therein). Specifically, the Horsehead Wideband High-resolution IRAM 30 m Surveys at two Positions with EMIR Receivers (WHISPER, PI: J. Pety) single-dish line survey provided a deep chemical inventory at two key locations2: the HCO emission peak (PDR position, Gerin et al. 2009) and the DCO+ emission peak (dense core position, Pety et al. 2007). Strikingly, this survey yielded the first PDR detections of complex species such as HCOOH, CH2CO, CH3CHO, and CH3CCH (Guzmán et al. 2014). Since then, several smaller molecules have been mapped at higher angular resolution with the Plateau de Bure Interferometer (PdBI; e.g., Guzmán et al. 2013, 2015) and the Atacama Large Millimeter/submillimeter Array (ALMA; e.g., Hernández-Vera et al. 2023), though similar mapping of COMs remains scarce.
For the present study, we investigated the spatial distribution of O-bearing and N-bearing organics at the UV-illuminated edge of the Horsehead nebula, combining ALMA and IRAM 30 m data to achieve ~15″ resolution (see Fig. 1 for an overview). We examined how the physical conditions of gas vary across the cloud and explored the chemical formation pathways of COMs under moderate FUV irradiation. Section 2 describes the observations and data combination. Section 3 presents the spatial distributions, physical conditions, and column densities of the analyzed species. In Sect. 4, we elaborate on the possible formation pathways of the studied molecules and discuss implications for FUV-driven organic chemistry in analogous environments. The main results and our conclusions are summarized in Sect. 5.
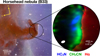 |
Fig. 1 Composite image of the field of view mapped in the Horsehead nebula (Barnard 33). Left: horsehead nebula and adjacent H II region IC 434 imaged by Euclid Early Release Observations (ESA/Euclid/Euclid Consortium/NASA). Right: zoomed-in image of the edge of the Horsehead nebula imaged with data combined from the ALMA 7 m and the IRAM 30 m telescopes. The emission of different N-bearing molecules are represented: CH3CN (JK = 60–50, in green) and HC3N (J = 11–10, in blue). The emission from hot ionized gas is also shown, traced by the Hα line (in red) observed with the 0.9 m KPNO telescope (Pound et al. 2003). The average beam size of the ALMA 7 m+30 m observations and a physical scale reference are shown in the bottom left and bottom right corner, respectively. |
2 Observations and data reduction
In this section, we describe the interferometric ALMA deep observations of simple organics and COMs taken at the edge of the Horsehead nebula that were combined with matched IRAM 30 m single-dish observations. For the analysis, they were complemented with Plateau de Bure Interferometer (PdBI) legacy data, previously published by Guzmán et al. (2013), and the publicly available WHISPER data.
2.1 ALMA 7 m observations
We used the ALMA Atacama Compact Array (hereafter ALMA 7 m) to perform deep observations of the Horsehead nebula at ~15″ between August 1, 2017, and October 1, 2017, during Cycle 4 (2016.2.00027.S, PI: V.V. Guzmán). There were 22 successful execution blocks (EBs), each lasting for about 1.5 h, with an on-source time of 0.8 h. Single pointing observations centered at ![Mathematical equation: $\[\alpha_{2000}=05^{\mathrm{h}} 40^{\mathrm{m}} 54^{\mathrm{s}}_\cdot555, \delta_{2000}=-02^{\circ} 27^{\prime} 48^{\prime \prime}_\cdot 6\]$](/articles/aa/full_html/2026/03/aa57383-25/aa57383-25-eq1.png) were carried out in Band 3 with projected baseline lengths between 5 and 49 m for an average of ten antennas per EB. The primary beamwidth at 100 GHz is 107.9″ (see Fig. 1, for a reference in physical units, assuming a distance of 400 pc). Quasar J0510+1800 or J0522–3627 was observed as the bandpass calibrator; J0423–0120, J0522–3627, or Uranus as the absolute flux calibrator; and J0541–0211 as the phase calibrator.
were carried out in Band 3 with projected baseline lengths between 5 and 49 m for an average of ten antennas per EB. The primary beamwidth at 100 GHz is 107.9″ (see Fig. 1, for a reference in physical units, assuming a distance of 400 pc). Quasar J0510+1800 or J0522–3627 was observed as the bandpass calibrator; J0423–0120, J0522–3627, or Uranus as the absolute flux calibrator; and J0541–0211 as the phase calibrator.
A single spectral setup was defined, covering the 98–113 GHz range and divided into nine spectral windows in the frequency division mode (FDM) of the correlator. As listed in Table A.1, these windows target the continuum at 3 mm and the following rotational transitions: carbon monoxide (C17O) J = 1–0, ketene (CH2CO) JKa,Kc = 515–414, acetaldehyde (CH3CHO) JKa,Kc = 514–413 (only E symmetry) and 616−515 (both E and A symmetries), isocyanic acid (HNCO) JKa,Kc = 505–404, cyanoacetylene (HC3N) J = 11–10, and methyl cyanide (CH3CN) JK = 60–50 (A), 61–51 (E), and 62−52 (E). Other molecules such as methyl isocyanide (CH3NC) and propynylidyne (l-C3H) were also targeted. The former was not detected, whereas the latter was, but its analysis lies beyond the scope of this work.
Due to the small aggregate bandwidth, the bandwidth-switching technique was adopted in order to improve the signal-to-noise ratios of the flux and gain calibration. Another spectral setup was defined for the calibrator scans. The calibration setup includes four wide-band spectral windows in the time division mode (TDM), centering at roughly 98.32, 100.28, 110.32, and 112.32 GHz with the channel spacing of 15.625 MHz and the bandwidth of 2.0 GHz. In each EB, the bandpass calibrator3 was observed in both FDM (narrow-band) and TDM (wide-band) setups to determine the phase differences between the FDM and TDM windows (see, e.g., ALMA Technical Handbook for details Cortes et al. 2025), while the flux and phase calibrators were observed with the TDM setup only.
The data were initially calibrated manually at the Joint ALMA Observatory (JAO) using the Common Astronomy Software Application (CASA)4 version 5.1.1 (McMullin et al. 2007; CASA Team 2022) with the calibration scripts created by the ALMA Script Generator (Petry et al. 2014). We have modified the scripts and recalibrated the data with CASA version 5.4.0 in order to optimize the spectral window mapping schemes for the system temperature (Tsys) and gain (amplitude and phase) calibrations. The Tsys of the calibrators and science target data were derived from the measurement scans of the same source and spectral window. The gain solutions for the narrow-band windows of the target were derived from the wide-band windows of the phase calibrator in the same baseband (see Table A.1). In addition, antenna CM06 was manually flagged due to unreliable Tsys values. After flagging, the on-source visibilities amount to about 14 hours of integration times with ten antennas.
2.2 IRAM 30m observations
As part of project 108–17, we used the EMIR receivers of the IRAM 30 m telescope to map during 47 hours a region of 180″ × 180" centered on ALMA 7 m pointing and rotated by 14° counterclockwise compared to the Equatorial 2000 coordinate frame. We used the narrow mode of the Fourier Transform Spectrometer that delivers four times 1.8 GHz of continuous bandwidths (two of them in each sideband) at a channel spacing of 50 kHz. We interleaved two different receiver tunings to cover continuously from the lower sideband from 93.65 to 100.55 GHz, and the upper sideband from 109.65 to 116.65 GHz. We used the position-switch, on-the-fly observing mode, covering each field with back-and-forth scans along either the right ascension or declination axes. We slewed at a speed of 8.5″ s−1 and we dumped data to disk every 0.5 s, yielding at least 5 integrations per beam in the scanning direction. The scan legs were separated by 8.5″, yielding Nyquist sampling transverse to the scan direction at 2.6 mm. We calibrated the system every 15 minutes.
The calibration of the data was done inside the GILDAS/MRTCAL software and the remaining of the processing happened in the GILDAS/CLASS software. Around the frequency of each line of interest, we extracted a frequency range of 100 MHz. We baselined the spectra by fitting a polynomial of order 1 after excluding the [8.5, 12.5 km s−1] velocity range. We converted the spectra intensity in main beam temperature using the standard Ruze formula for the IRAM 30 m telescope. Finally we resampled the velocity axis to match the ALMA 7 m axis, and we gridded the data in a cube of 4″ × 4″ pixels.
2.3 Interferometric and single-dish data combination
We combined the IRAM 30 m and ALMA 7 m to produce a clean image containing all spatial information from 0 to 50 m, i.e., equivalent to a 50 m diameter total-power telescope. The IRAM 30 m map is deconvolved from the 30 m beam in the Fourier plane before multiplication by the ALMA 7 m primary beam in the image plane. After a last Fourier transform, pseudo-visibilities were sampled between 0 and 7 m. These visibilities were then merged with the ALMA 7 m interferometric observations (see Rodriguez-Fernandez et al. 2008, for details). Standard imaging, CLEAN deconvolution, and primary beam correction steps were then applied. The resulting data cube was then scaled from Jy beam−1 to Tmb temperature scale using the synthesized beam size. All these processes happened in the GILDAS/MAPPING software.
The observational parameters of the final combined (hereafter ALMA 7 m+30 m) images are summarized in Table 1. The channel rms is calculated using the central 50% of the pixels in the first and last five (line-free) channels of the data cubes. To compare the spatial distribution of the different molecular tracers, we collapse the line emission into velocity-integrated intensity, or zeroth-moment, maps using the CASA task immoments. The zeroth-moment rms is estimated as ![Mathematical equation: $\[\sigma_{\text {rms}} \approx \sigma_{\text {chan}} \sqrt{N_{\text {chan}}} \Delta v\]$](/articles/aa/full_html/2026/03/aa57383-25/aa57383-25-eq2.png) , where σchan is the channel rms, Nchan is the number of channels used to compute the zeroth-moment, and Δv is the channel spacing in velocity.
, where σchan is the channel rms, Nchan is the number of channels used to compute the zeroth-moment, and Δv is the channel spacing in velocity.
2.4 Legacy data
The analysis of the ALMA 7 m+30 m data was complemented with PdBI observations of formaldehyde (H2CO) JKa,Kc = 202 − 101 and methanol (CH3OH) JK = 3−1–2−1 (E symmetry) rotational transitions imaged at θbeam ~ 6″. All the observational details of these legacy data can be found in Guzmán et al. (2013). In order to make the two data sets comparable, the PdBI data was rotated by 14°, and the angular resolution was downgraded to θbeam ~ 15″ to match the ALMA 7 m+30 m data using the CASA tools rotate and convolve2d, respectively. Afterward, the spatial axes were regridded using the CASA task imregrid to match the number of pixels per beam. Throughout this procedure, the CH3CN image was used as a template. Thus, for all subsequent analysis, the angular resolution of the H2CO and CH3OH images is exactly the same as for CH3CN (see Table 1).
Additionally, we extracted from the WHISPER line survey5 the spectra of the J = 1–0 (θbeam ~ 22″) and 2–1 (θbeam ~ 11″) rotational transitions for the C17O and C18O isotopologues at the PDR and dense core positions, to estimate the C17O/C18O ratio in the Horsehead nebula and find the excitation temperature of C17O (see Sect. 3.2.1 and Appendix B.1). The observational details of WHISPER can be found in any of the survey papers (e.g., Guzmán et al. 2012; Pety et al. 2012).
3 Results
This section presents the main findings from our combined ALMA 7 m+30 m observations. We describe the spatial distribution of simple and complex organics in the Horsehead nebula, based on integrated intensity maps and their corresponding horizontal profiles at key vertical positions. Next, we detail the radiative transfer modeling used to constrain the physical conditions and derive column density profiles for each organic species. Finally, we compare our results with previous studies in the same source and discuss the differences and similarities among the species analyzed.
3.1 Spatial distribution of molecules
Figure 2 shows the gallery of zeroth-moment maps for all the molecular species listed in Table 1, except for C17O that is shown in Fig. B.2. Following the usual conventions of previous work, the maps were rotated 14° counterclockwise to bring the exciting star direction in the horizontal δx direction. By doing this, a new rotated coordinate system is defined where the horizontal zero (δx = 0) corresponds to the empirical PDR edge (red line, Fig. 2) usually defined at the sharp boundary of the molecular cloud traced by the H2 ro-vibrational line emission (Pety et al. 2005). Using the rotated coordinates, the PDR (green cross, Fig. 2) and dense core (cyan cross, Fig. 2) are located at (![Mathematical equation: $\[\delta x \approx 15^{\prime \prime}_\cdot 1, \delta y \approx 1{ }^{\prime \prime}_\cdot2\]$](/articles/aa/full_html/2026/03/aa57383-25/aa57383-25-eq4.png) ) and (
) and (![Mathematical equation: $\[\delta x \approx 44^{\prime \prime}_\cdot7, \delta y \approx 16^{\prime \prime}_\cdot 5\]$](/articles/aa/full_html/2026/03/aa57383-25/aa57383-25-eq5.png) ), respectively.
), respectively.
The visual inspection of Fig. 2 reveals a distinct trend: most molecules, except for HC3N, show a filament structure whose emission peak is at the PDR position. However, it is also clear that O-bearing and N-bearing molecules apparently have different spatial distributions, which probably implies disparities in their chemistry (see Sect. 4, for a detailed discussion). In addition to exhibiting a filament at the PDR, O-bearing species, such as CH2CO and CH3CHO, have an extended component towards the position of the dense core, following the shape of the “Horsehead pillar” typically shaped by large-scale structure maps of CO isotopologues (Roueff et al. 2024; Ségal et al. 2024, see also Fig. B.2). Instead, N-bearing species, such as CH3CN and HC3N, are notably different. CH3CN lacks significant extended emission at the dense core and the PDR filament is thinner than the O-bearing ones. In contrast, HC3N reveals a more clumpy morphology concentrated close to the dense core. In between, we have HNCO, exhibiting characteristics of both types of species: a sharply defined filament across the PDR along with some extended emission near the dense core, consistent with its dual N and O composition.
Interestingly, both the filament centered at the PDR and the clumps close to the dense core have been previously seen by higher angular resolution data of other molecules. Guzmán et al. (2013) showed that H2CO emission presents a similar morphology, and suggested it is a consequence of dust-grain versus gas-phase chemistry at the PDR and dense core, respectively. Consistently, Hernández-Vera et al. (2023) concluded that HCO+ exhibits a similar type of distribution since it traces the dense UV-shielded gas but also the more diffuse edge of the molecular cloud exposed to stellar UV radiation. Thus, the different distributions of CH3CN and HC3N seen in the maps could be direct evidence of different formation pathways, as previously suggested by Gratier et al. (2013), or variations on the gas-phase C/O ratio, as mentioned by Le Gal et al. (2019). Likewise, similarities between CH2CO and CH3CHO might be associated with common formation routes, as proposed by Guzmán et al. (2014). More details on the possible formation pathways are discussed in Sect. 4.
Similar to previous works (e.g., Guzmán et al. 2015; Hernández-Vera et al. 2023), we extracted horizontal cuts from the maps to quantify the distribution of the line emission as a function of δx, particularly at the δy position of the PDR and dense core. In this case, we averaged the integrated line intensity over 10″ in the δy direction since it roughly matches the beam of the observations in that direction (see right panels, Fig. 3). Hereafter, we decided to include the convolved maps of H2CO and CH3OH in the analysis to compare the emission of these smaller species with the larger COMs presented here. Moreover, they can be essential precursors of more complex species (Öberg et al. 2009; López-Sepulcre et al. 2024).
Figure 3 shows the integrated intensity profiles extracted at ![Mathematical equation: $\[\delta y \approx 1^{\prime \prime}_\cdot2\]$](/articles/aa/full_html/2026/03/aa57383-25/aa57383-25-eq6.png) (PDR) and
(PDR) and ![Mathematical equation: $\[\delta y \approx 16^{\prime\prime}_\cdot5\]$](/articles/aa/full_html/2026/03/aa57383-25/aa57383-25-eq7.png) (dense core). The uncertainties of each profile incorporate the standard deviation of the average along the δy direction and the zeroth-moment rms from Table 1, added in quadrature. We also accounted for an absolute flux calibration uncertainty of approximately 5%. For H2CO and CH3OH, the zeroth-moment rms is estimated from the observational parameters reported by Guzmán et al. (2013). It is now more evident that most molecules shown in Fig. 2 have their emission peak at the PDR filament and that the N-bearing molecules CH3CN and HC3N have different spatial distributions. Hence, to further explore the above, we used the integrated intensity profiles to determine the gas physical conditions and the column densities profiles for each molecule.
(dense core). The uncertainties of each profile incorporate the standard deviation of the average along the δy direction and the zeroth-moment rms from Table 1, added in quadrature. We also accounted for an absolute flux calibration uncertainty of approximately 5%. For H2CO and CH3OH, the zeroth-moment rms is estimated from the observational parameters reported by Guzmán et al. (2013). It is now more evident that most molecules shown in Fig. 2 have their emission peak at the PDR filament and that the N-bearing molecules CH3CN and HC3N have different spatial distributions. Hence, to further explore the above, we used the integrated intensity profiles to determine the gas physical conditions and the column densities profiles for each molecule.
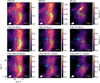 |
Fig. 2 Zeroth-moment maps gallery for different molecular species moderately resolved at the Horsehead edge. The maps have been rotated 14° counterclockwise to bring the illuminating star direction in the horizontal direction. The contours are [3, 5, 10, 15, 20, 25, 30] × σ, where σ is the zeroth-moment rms listed in Table 1. The red vertical line represents the horizontal zero, delineating the PDR edge (Pety et al. 2005), whereas the cyan and green crosses show the dense core (Pety et al. 2007) and PDR (Gerin et al. 2009) positions, respectively. The beam size and a scale bar indicating 4000 au are shown in the bottom left and bottom right corner, respectively, of each panel. Transitions corresponding to the same molecular species are shown using the same color-scale range. |
3.2 Radiative transfer modeling
We have performed radiative transfer calculations to model the line intensities shown in Fig. 3. Typically, the usual way of doing this is through a rotational diagram analysis (Goldsmith & Langer 1999), which assumes optically thin emission and level populations following a Boltzmann distribution characterized by a single excitation temperature (Tex) and the total column density of the molecule (N). Under local thermodynamic equilibrium (LTE), Tex provides a good approximation of the gas kinetic temperature (Tkin). However, previous studies have shown that complex molecules in the Horsehead edge are, in general, subthermally excited (Tex < Tkin; see Guzmán et al. 2014, and references therein). Therefore, to obtain more accurate results, it is always desirable to take a non-LTE approach, in which both collisional and radiative de-excitation must be considered.
We used the non-LTE radiative transfer code RADEX (van der Tak et al. 2007). More specifically, we ran our analyses using the Python-wrapped version SpectralRadex6 (Holdship et al. 2021). Taking this approach, the modeled emission of a specific molecule (in units of K km s−1) will depend on three free parameters: the gas density of the collisional partners, typically H2 (nH2)7, the gas temperature (Tkin), and the total column density of the molecule (N). Other parameters, such as the background temperature (Tbg) and the linewidth (Δv), can also be varied. For simplicity, and because they are not expected to vary significantly across the analyzed region, we kept them fixed at Tbg = 2.73 K (CMB temperature) and Δv = 0.6 km s−1, as supported by previous studies (Gratier et al. 2013; Guzmán et al. 2014).
We fitted the modeled emission to the observed integrated intensities by constructing a likelihood function, ℒ (data, free parameters), and performing a χ2 minimization. To retrieve the posterior probability distributions of the free model parameters, we employed the affine-invariant Markov chain Monte Carlo (MCMC) algorithm implemented in the emcee package (Foreman-Mackey et al. 2013). The number of walkers was set to four times the number of free model parameters, with 2000 burn-in steps and an additional 3000 steps used to sample the posterior distributions. The observational uncertainties used in the fit correspond to those shown in the profiles in Fig. 3. The best-fit values and their associated uncertainties were derived from the 16th, 50th, and 84th percentiles of the posterior distributions.
The number of free model parameters in the fit depended on the number of observed transitions available for each molecule. For CH3CN, which has multiple detected rotational lines, we allowed Tkin and N to vary freely. For the other molecules, which had only one or two detected lines, we fixed some of the physical parameters (typically nH2 and/or Tkin) based on the results from CH3CN or literature values, and then constrained the column density N through the fitting. To avoid oversampling given the ~15″ beam size, the full analysis was carried out at intervals of ~7.5″, ensuring that each measurement is separated by approximately half a beam.
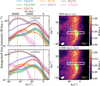 |
Fig. 3 Left column: integrated line intensity profiles along the direction of the exciting star extracted from the maps shown in Fig. 2 and the convolved maps obtained from Guzmán et al. (2013). For molecules with more than one transition, the brightest is displayed. The profiles were extracted at the δy position of the PDR (top panel) and dense core (bottom panel), and averaged over 10″ in the δy direction. The dotted vertical lines represent the δx position of the PDR and dense core, and the vertical red line represents the PDR edge. The average beam size is represented by the horizontal gray bar. The colored area of each profile displays the ±σ significance levels, taking into account the standard deviation of the average and the zeroth-moment rms. Right column: regions used to extract the profiles, indicated by white rectangles overlaid on the HNCO zeroth-moment map. The two crosses, the red vertical line, and the contours are the same as in Fig. 2. |
3.2.1 C17O-to-H2 conversion factor and N(C18O)/N(C17O) ratio
One key parameter for the non-LTE radiative transfer analysis is nH2. As the second most abundant molecule in the universe, and given the difficulties of directly observing H2, CO has been historically used to trace the amount of cold molecular gas (Bolatto et al. 2013). Since CO emission is typically optically thick, observations from less abundant isotopologues are more desirable. Nevertheless, sometimes even 13CO emission is optically thick, and thus the use of rarer isotopologues, such as C17O, is needed. Since we have prior information about nH2 at the PDR and dense core, we first fitted the C17O emission at these two specific positions to calibrate the C17O-to-H2 conversion, and then extended it to the other δx positions to derive an nH2 profile.
Although the collisional rates of C17O with H2 are available (Yang et al. 2010), we decided to model the emission using the LTE approach. This is a reasonable assumption, given that the critical density of the C17O J = 1–0 transition is generally ncrit < nH2 (see Table C.1) for the typical gas densities (nH2 ~ 104−4105 cm−3) and temperatures (Tkin ≲ 100 K) observed in the inner layers of the Horsehead nebula (Habart et al. 2005; Pety et al. 2005). Furthermore, we modeled the spectral lines directly, rather than the integrated intensity, to properly account for the hyperfine structure of the emission. Following the procedure described in Hernández-Vera et al. (2024), the line intensity (Iν) in LTE can be expressed in terms of N, Tex, and Δv. However, since we only had one C17O transition observed with ALMA 7 m+30 m, it was not possible to simultaneously constrain all three parameters.
Therefore, taking advantage of its wide spectral coverage, we used WHISPER data to simultaneously fit the C17O 1–0 and 2–1 transitions. We also fitted the same transitions for C18O to determine the C18O/C17O ratio and verify the consistency of our C17O conversion factor with other CO isotopologues. All relevant spectroscopic constants used for the hyperfine structure fitting are provided in Table C.1, and the best-fit models are shown in Fig. B.1. Each hyperfine component was modeled as an independent Gaussian with fixed velocity separations, given that they are partially blended at the 0.2 km s−1 resolution. Their relative intensities were set by the ratios of the upper-state degeneracies, gu, and the Einstein coefficients, Aul. From these results, we derive an average isotopologue ratio of N(C18O)/N(C17O) = 3.6 ± 0.5, in good agreement with the local ISM 18O/17O element ratio (3.2, Wilson & Rood 1994).
Interestingly, a Tex value of < 20 K for C17O and C18O appears to be appropriate for both the PDR and dense core positions. However, given the low ncrit of their rotational transitions, LTE conditions would imply Tex ≈ Tkin = 60 K for the PDR (Gerin et al. 2009). Since the emission is barely resolved, the beam likely includes contributions from the colder, denser cloud interior rather than solely from the PDR. To test this, we repeated the analysis with SpectralRadex, fixing nH2 to values from previous work (Gerin et al. 2009), and obtained similarly low Tkin and Tex values (~13–20 K), revealing beam pickup from colder material within the cloud that is likely in LTE.
Hence, with the excitation temperature fixed at Tex = 15 K, we repeated the fitting procedure but now for the ALMA 7 m+30 m data, leaving N and Δv as free parameters. This approach allows us to determine N(C17O) – needed to estimate nH2 – while Δv is constrained by fitting the hyperfine components of the observed transition. The best-fit models for the PDR and dense core positions are shown in Fig. B.2. Defining the C17O-to-H2 conversion factor as XC17O = N(H2)/N(C17O), we combined the N(H2) estimates for the PDR and dense core from Guzmán et al. (2014) with our N(C17O) measurements to derive empirical conversion factors for the Horsehead nebula. The resulting values are XC17O = (4.0 ± 0.2) × 106 for the PDR and XC17O = (5.9 ± 0.3) × 106 for the dense core.
Being a less abundant isotopologue, C17O is not commonly used as a tracer of H2 column density. As a consistency check, we used our newly derived N(C18O)/N(C17O) ratio to compare our XC17O conversion factor with values reported in the literature. Assuming N(13CO)/N(C18O) ~ 8 (Roueff et al. 2024; Ségal et al. 2024), N(C18O)/N(C17O) ~ 3.6 (this work), and XC17O = 5.0 × 10⁶ (average value), we determined a 13CO-to-H2 conversion factor of X13CO ~ 1.7 × 10⁵, which is somewhat lower than previous results in the Orion B molecular cloud (4.0 × 10⁵, Roueff et al. 2021) and other typical ISM estimates (3.8 × 10⁵, Bolatto et al. 2013). Since we are observing a PDR environment, this discrepancy is likely due to more efficient selective photodissociation of C17O and C18O compared to the more abundant isotopologue 13CO, as both C17O and C18O become abundant only deeper into the cloud, well behind the H/H2 transition.
3.2.2 Gas density based on C17O observations
Once the XC17O conversion factor was established, we extended the same fitting procedure of C17O ALMA 7 m+30 m data to all other δx positions at the δy locations of the PDR and dense core, using the range shown in Fig. 3. This yielded N(C17O) profiles that we converted into nH2 profiles. The advantage of this method is that, by using ALMA 7 m+30 m data, we obtain empirical gas density profiles at the same angular resolution as the other molecular line observations, thus enabling more accurate column density determinations for the organic species analyzed in this work.
Assuming a typical cloud depth along the line of sight of ℓdepth ≃ 0.1 pc (Habart et al. 2005; Lis et al. 2026), and accounting for the fact that the empirical XC17O value varies between the PDR and dense core, we defined the conversion from N(C17O) to nH2 as
![Mathematical equation: $\[n_{\mathrm{H}_2}(\delta x)=\frac{X_{\mathrm{C}^{17} \mathrm{O}}(\delta x) N\left(\mathrm{C}^{17} \mathrm{O}\right)(\delta x)}{\ell_{\mathrm{depth}}},\]$](/articles/aa/full_html/2026/03/aa57383-25/aa57383-25-eq8.png) (1)
(1)
where XC17O(δx) is obtained by linear interpolation and extrapolation of the empirical conversion factors determined at the positions of the PDR and dense core. This approach preserves consistency with previous nH2 determinations at these positions, while providing a smoothly varying profile between them.
The top panel of Fig. 4 shows the resulting nH2 profiles for the PDR and dense core vertical positions, along with the profile modeled by Habart et al. (2005) convolved with a 15″ full width at half maximum (FWHM) Gaussian to facilitate comparison with the ALMA 7 m+30 m data. Both profiles confirm the presence of a steep density gradient, with typical values of nH2 ~ 104−105 cm−3. Although lower densities in the surface layers of the cloud are also plausible (nH2 ≲ 103 cm−3, Hernández-Vera et al. 2023), non-LTE effects and beam pickup from colder and denser regions could still bias the inferred C17O column densities upward, and thus the nH2 values derived at the edge of the cloud.
3.2.3 Gas temperature based on CH3CN observations
CH3CN is often considered as a “good thermometer” due to its properties of symmetric top molecule (e.g., Guesten et al. 1985). Considering that there cannot be radiative transitions between different K-ladders, the energy levels with different K values are populated by collisions. Therefore, the relative intensities between transitions with the same J but different K values are sensitive to Tkin.
As described at the beginning of Sect. 3.2, we used SpectralRadex to model the integrated line intensity of the three CH3CN J = 6–5 (K = 0, 1, and 2) transitions simultaneously. In this case, we decided to employ the non-LTE approach since Gratier et al. (2013) demonstrated that CH3CN emission at the Horsehead PDR is subthermally excited. The collisional rates were taken from Ben Khalifa et al. (2023), and we assumed a ratio of E/A = 1 between the two noninteracting torsional sub-states. Using the nH2 values derived from C17O as input, the modeled CH3CN intensities only depend on Tkin and N(CH3CN) as free parameters. The best-fit integrated intensity models are shown in Fig. B.3. The resulting Tkin profiles for the PDR and dense core vertical positions are shown in the middle panel of Fig. 4, whereas the N(CH3CN) profiles are shown in Figs. 5 and D.1.
We have obtained temperature values of ![Mathematical equation: $\[T_{\text {kin }}=58_{-10}^{+13} \mathrm{~K}\]$](/articles/aa/full_html/2026/03/aa57383-25/aa57383-25-eq9.png) for the PDR position (
for the PDR position (![Mathematical equation: $\[\delta x \approx 15^{\prime \prime}_\cdot 1, \delta y \approx 1^{\prime \prime}_\cdot 2\]$](/articles/aa/full_html/2026/03/aa57383-25/aa57383-25-eq10.png) ) and
) and ![Mathematical equation: $\[T_{\text {kin}}=28_{-10}^{+11} \mathrm{~K}\]$](/articles/aa/full_html/2026/03/aa57383-25/aa57383-25-eq11.png) for the dense core position (
for the dense core position (![Mathematical equation: $\[\delta x \approx 44^{\prime \prime}_\cdot 7, \delta y \approx 16^{\prime\prime}_\cdot5\]$](/articles/aa/full_html/2026/03/aa57383-25/aa57383-25-eq12.png) ), which is in good agreement with previous estimates using CH3CN (Gratier et al. 2013) and other molecular tracers (Pety et al. 2007; Gerin et al. 2009; Guzmán et al. 2013). Regarding the other profile positions, we have empirically demonstrated the presence of a temperature gradient, as earlier pointed out by observations (Pety et al. 2005) and models (Goicoechea et al. 2009b; Le Gal et al. 2017, 2019). In this case, the temperature derived from CH3CN at the PDR is significantly higher than that estimated from C17O using WHISPER observations. Although the beam sizes are not very different in the δx direction, the spatial distribution of C17O is much more extended than that of the CH3CN filament, which shows almost no counterpart in the dense core and likely minimizes beam-pickup effects from colder interior regions.
), which is in good agreement with previous estimates using CH3CN (Gratier et al. 2013) and other molecular tracers (Pety et al. 2007; Gerin et al. 2009; Guzmán et al. 2013). Regarding the other profile positions, we have empirically demonstrated the presence of a temperature gradient, as earlier pointed out by observations (Pety et al. 2005) and models (Goicoechea et al. 2009b; Le Gal et al. 2017, 2019). In this case, the temperature derived from CH3CN at the PDR is significantly higher than that estimated from C17O using WHISPER observations. Although the beam sizes are not very different in the δx direction, the spatial distribution of C17O is much more extended than that of the CH3CN filament, which shows almost no counterpart in the dense core and likely minimizes beam-pickup effects from colder interior regions.
However, we did not recover the high temperatures (Tkin ≳ 100 K) expected at the very edge of the cloud (Zannese et al. 2025a), in part because the collisional rates used were tabulated only up to 100 K. Still, the posterior probability distributions showed no indication of a preference for higher temperatures. This discrepancy likely stems from the limited angular resolution and sensitivity of the observations, which may prevent detection of the outermost regions of the cloud, characterized by lower column densities and, consequently, lower surface brightness.
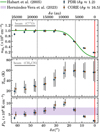 |
Fig. 4 Empirical gas density (top panel), kinetic temperature (middle panel), and thermal pressure (bottom panel) profiles determined from C17O and CH3CN observations of the Horsehead edge, extracted at the δy position of the PDR (blue circles) and dense core (orange circles). The beam sizes of the respective molecular tracers from which the values were derived are represented by the horizontal gray bar in the top left corner of each panel. The red vertical line and the dotted vertical lines are the same as in the left panels of Fig. 3. For comparison, the gas density profile modeled by Habart et al. (2005) convolved with a Gaussian of 15″ FWHM (green line) and the thermal pressure range from Hernández-Vera et al. (2023) (purple-shaded region) are also shown. |
3.2.4 Gas thermal pressure
Having derived empirical profiles for the gas density and kinetic temperature, we computed the corresponding thermal pressure, defined as Pth = nHTkin, where nH = n(H) + 2n(H2) ~ 2nH2 corresponds to the total hydrogen nuclei density. The resulting Pth profiles for the vertical positions of the PDR and dense core are shown in the bottom panel of Fig. 4, together with the range of values determined from high angular resolution observations by Hernández-Vera et al. (2023)8.
These results corroborate the presence of high thermal pressures at the Horsehead edge, exceeding those measured in the adjacent IC 434 H II region (Bally et al. 2018), in agreement with a photoevaporative compression scenario. Moreover, to first order, the Horsehead PDR appears to maintain an isobaric structure: although some variations are present, most values remain, within uncertainties, consistent with the range reported by Hernández-Vera et al. (2023). These findings add compelling new observational support to previous evidence that PDRs can often be represented as isobaric regimes with large thermal pressures regulated by the intensity of the incident UV radiation field (Goicoechea et al. 2016; Joblin et al. 2018; Wu et al. 2018; Bron et al. 2018; Maillard et al. 2021; Hernández-Vera et al. 2023; Clark et al. 2025).
3.2.5 Column density profiles
The integrated line emission of the remaining molecules was modeled to obtain column density profiles and further investigate the formation pathways of the different chemical species. Although it was mentioned that complex molecules in the Horsehead nebula are subthermally excited (i.e., ncrit < nH2, see Table C.1), we cannot use the RADEX non-LTE approach for all the species presented in this work since not all have collisional rates available in the literature.
Thus, for those species with available rates, such as H2CO (Wiesenfeld & Faure 2013), CH3OH (Rabli & Flower 2010), HNCO (Sahnoun et al. 2018), and HC3N (Faure et al. 2016), we performed a similar procedure as CH3CN but using the nH2 and Tkin profiles derived in the previous sections as input. Instead, for CH2CO and CH3CHO, we used the rotational diagram approach by assuming a Boltzmann distribution of the rotational levels characterized by a single Tex lower than Tkin, consistent with a subthermal excitation regime. Under this assumption, the column density in the upper state of a given transition (Nu) is given by
![Mathematical equation: $\[N_u=\frac{N}{Q\left(T_{\mathrm{ex}}\right)} g_u e^{-E_u / k T_{\mathrm{ex}}},\]$](/articles/aa/full_html/2026/03/aa57383-25/aa57383-25-eq13.png) (2)
(2)
where N is the total column density, Q is the partition function of the molecule taken from the JPL database (Pickett et al. 1998), and Eu with gu are the energy and the degeneracy associated with the upper-state level of the corresponding transition, respectively (see Table C.1). On the other hand, assuming optically thin emission, Nu is related to the integrated line intensity (I = ∫ Iνdν, in K km s−1) through the equation
![Mathematical equation: $\[I=\frac{h c^3 A_{u l}}{8 \pi k \nu^2} N_u,\]$](/articles/aa/full_html/2026/03/aa57383-25/aa57383-25-eq14.png) (3)
(3)
where ν is the line frequency and Aul is the Einstein coefficient (see Table C.1). By putting Eq. (2) into Eq. (3), the integrated line intensity can therefore be written as a function of N and Tex. Similar to the C17O case, we fixed the excitation temperature at Tex = 15 K for CH2CO and Tex = 8 K for CH3CHO, based on previous work (Guzmán et al. 2014).
Hence, either using the non-LTE approach implemented by SpectralRadex or the rotational diagram approach through Eqs. (2) and (3), the only free parameter to fit is N. The fitting strategy was essentially the same as for CH3CN, which is illustrated in Appendix B.3. It is worth mentioning that, similar to the case of CH3CN, we assumed E/A = 1 for CH3OH and CH3CHO and an ortho-to-para ratio of OPR = 3 for H2CO and CH2CO since we do not have any information about these symmetry ratios and nuclear spin forms in positions other than the PDR and the dense core. In these cases, the total column density corresponds to the sum of the different symmetries (E+A) or nuclear spin forms (ortho+para).
Figure 5 shows the derived column density profiles for the PDR vertical position, while the corresponding profiles for the dense core vertical position are presented in Fig. D.1. Since the profiles at both positions are very similar, we refer only to Fig. 5 in the subsequent analysis, with the understanding that the same conclusions apply to the dense core vertical position. The associated uncertainties correspond to the statistical propagation of observational errors, without including systematic uncertainties on the fixed parameters, as this would require exploring a multi-dimensional parameter space in density and temperature, which is beyond the scope of this work. We checked the consistency of our results by comparing them with previous efforts. Since this is the first time that the column density of these molecules is spatially imaged, the only benchmarks that we have are the values derived at the PDR and dense core positions from prior single-dish observations, except for HNCO for which there are no results reported in the literature.
For the molecules observed with the PdBI, our results are consistent within the uncertainties with the values determined by Guzmán et al. (2013) using the IRAM 30 m spectra only, confirming that the emission of H2CO and CH3OH is only marginally diluted. Instead, for the combined ALMA 7 m+30 m maps, most of our column densities are higher than previous results from the WHISPER line survey (Gratier et al. 2013; Guzmán et al. 2014), specifically by a factor of ~3–4 in the dense core and a factor of ~3–6 in the PDR. Beam dilution effects can explain the above since, from the maps shown in Fig. 2, we can see that we begin to resolve filamentary and clumpy structures with angular widths on the order of θsource ~ 10–15″ that probably were diluted by the large beam size reached by WHISPER (θbeam ≳ 27″, Guzmán et al. 2014).
For CH3CN, at the PDR position we found a column density ~0.5 times lower than that reported by Gratier et al. (2013) using WHISPER data. However, Gratier et al. (2013) already accounted for beam dilution in their radiative transfer modeling, which explains why we find a similar column density with the new higher angular resolution observations. At the dense core, in contrast, we find a higher CH3CN column density (by a factor of ~3) compared to Gratier et al. (2013). This discrepancy is likely due to the choice of collisional rates: Gratier et al. (2013) adopted the rates from Green (1986), whereas Ben Khalifa et al. (2023) recently showed that those rates can be severely under-estimated for some transitions, especially at low temperatures (Tkin = 20 K) such as those found in the dense core. When we repeated our analysis using the older rates from Green (1986), our derived N values matched those reported by Gratier et al. (2013). In the PDR, on the other hand, the choice of collisional coefficients has a less significant effect.
Concerning the shape of the N profiles, we find that HNCO, CH3CN, CH2CO, and CH3CHO present higher column densities at the edge of the Horsehead nebula, with their peak near the PDR position. This suggests that their formation is enhanced in the presence of FUV radiation, consistent with the modern view of PDRs in which FUV photons can promote the production of certain molecules (e.g., Goicoechea et al. 2025). In contrast, we find that CH3OH and HC3N present higher column densities in deeper layers of the Horsehead nebula, with their peak near the dense core. These molecules are probably formed (or survive) more efficiently or readily desorbed into the gas-phase when shielded from FUV radiation. Lastly, H2CO stands out for its high abundance in both FUV-exposed and FUV-shielded layers of the Horsehead nebula, indicating that it can form efficiently under a range of physical conditions.
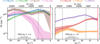 |
Fig. 5 Column density profiles derived at the δy position of the PDR from the radiative transfer modeling of the O-bearing (left panel) and N-bearing (right panel) molecules analyzed in this work. For each color the solid line depicts the best-fit values, whose uncertainties are represented by the shaded areas of the same color. The red vertical line, the dotted vertical lines, and the horizontal gray bar are the same as in the left panels of Fig. 3. The same profiles, but at the δy position of the dense core, are shown in Fig. D.1. |
4 Discussion
4.1 Chemistry of O-bearing species
Figure 5 reveals clear differences in the column density distributions of molecular species with similar elemental compositions, likely reflecting distinct underlying chemical processes. In the case of O-bearing species, H2CO and CH3OH have their peak closer to the dense core position, whereas CH2CO and CH3CHO exhibit larger values near the PDR. This may seem surprising, considering that both molecular pairs are thought to be efficiently formed on dust grain surfaces through CO hydrogenation (see Herbst & van Dishoeck 2009, and references therein). However, the observed chemical differentiation may arise from the presence of an additional C atom that distinguishes the two groups of molecules.
Recent estimates of the binding energy of atomic C onto grain surfaces are reshaping the classical view proposed by early PDR models (e.g., Hollenbach et al. 2009). These models typically assumed a low binding energy (Eb ~ 800 K, Hasegawa & Herbst 1993), implying that atomic C would freeze out onto grains only at very low temperatures (Tkin ≲ 20 K). However, more recent quantum chemical calculations suggest much higher binding energies (Eb > 104 K, Shimonishi et al. 2018; Duflot et al. 2021; Minissale et al. 2022), indicating that atomic C can deplete at significantly higher temperatures onto amorphous water ices, as those expected to coat grains within the interior of the Horsehead nebula (Schirmer et al. 2020; Abergel et al. 2024).
This is supported by the fact that laboratory experiments have demonstrated that the surface diffusion of C atoms can be a considerable alternative to increase the complexity of organic molecules in translucent clouds (Tsuge et al. 2023). Certainly, previous studies have suggested that the formation of CH2CO and CH3CHO can be initiated by the barrierless reaction C + CO → C2O (Maity et al. 2014; Fedoseev et al. 2022; Borshcheva et al. 2025), avoiding HCO as an intermediate product, which is the common ancestor with H2CO and CH3OH. Additionally, the grain surface chemistry of CH2CO and CH3CHO can be favored by reactions involving CH2 (Chen et al. 2025) and C2H2 (Chuang et al. 2020), which can be also produced by C diffusive reactions (Tsuge et al. 2023; Ferrero et al. 2024).
Near the PDR position, the presence of FUV radiation leads to the photodissociation of CO, resulting in the coexistence of CO, atomic C, and C+ at the illuminated edge of the Horsehead nebula (Philipp et al. 2006; Bally et al. 2018; Hernández-Vera et al. 2023). Atomic C can then be physisorbed onto H2O-rich ices on shallow binding sites, allowing its efficient diffusion for dust temperatures above ~22 K (Tsuge et al. 2023), consistent with the conditions expected at the Horsehead PDR (Tdust ~ 30 K, Goicoechea et al. 2009a). In contrast, in the dense core where dust temperatures are lower (Tdust ~ 20 K, Goicoechea et al. 2009a), CO freeze-out becomes more relevant and atomic C diffusion is less efficient. Under these conditions, CO hydrogenation likely dominates, enhancing the formation of H2CO and CH3OH.
Interestingly, although H2CO is more abundant near the dense core, it also shows a significant contribution from the PDR, comparable to that of CH2CO and CH3CHO. This suggests that atomic C may also play a key role in the grain-surface formation of H2CO. In fact, an alternative to the traditional CO hydrogenation pathway involves the surface reaction C + H2O → H2CO, recently supported by both computational studies (Molpeceres et al. 2021) and laboratory experiments (Potapov et al. 2021). Consistently, Tsuge et al. (2023) found that a considerable fraction of the atomic C physisorbed onto H2O-rich ices reacts rapidly and forms H2CO.
An increased production of H2CO on grains enhances the cold formation pathways of CH2CO and CH3CHO, but also CH3OH (Potapov & Garrod 2024). However, under FUV irradiation, CH3OH tends to fragment into smaller radicals, which can subsequently lead to the formation of CH2CO and CH3CHO (Yocum et al. 2021), or even regenerate H2CO (Bertin et al. 2016). Furthermore, while CH3OH is predominantly formed via surface reactions on dust grains (Watanabe & Kouchi 2002; Fuchs et al. 2009), CH2CO, CH3CHO, and H2CO also follow viable gas-phase formation pathways (Ruiterkamp et al. 2007; Vazart et al. 2020; Ramal-Olmedo et al. 2021), as shown by recent detections of these species in diffuse gas lacking ice mantles (Gerin et al. 2025).
These pathways typically involve reactions between atomic O and hydrocarbon radicals – specifically, C2H3, C2H5, and CH3 for CH2CO, CH3CHO, and H2CO, respectively – highlighting another possible chemical link among the three species. Notably, atomic O has been detected at the edge of the Horsehead nebula (Goicoechea et al. 2009a), and the hydrocarbon radicals may originate from the photodissociation of closed-shell hydrocarbons like C2H6 and CH4 (Heays et al. 2017), which themselves are efficient products of grain-surface C chemistry (Kobayashi et al. 2017; Qasim et al. 2020; Tsuge et al. 2024). This would reflect a form of top-down hydrocarbon chemistry, complementing that previously proposed for PAHs at the edge of the Horsehead nebula (Pety et al. 2005; Guzmán et al. 2015).
Overall, whether O-bearing molecules form on dust grains or in the gas phase, the presence of atomic C under FUVilluminated conditions appears to play a key role in driving their chemical complexity at relatively low temperatures (Tkin ≲ 100 K). In the dense core, by contrast, CO hydrogenation leading to H2CO and CH3OH becomes more important, since atomic C is less abundant and its diffusion on grain surfaces is less efficient. The UV-shielded conditions also limit the fragmentation of CH3OH, thereby influencing the formation of CH2CO and CH3CHO. Notably, the prominent detection of CH3OH – and O-bearing species in general – in the gas phase of the dense core may serve as direct evidence of chemical desorption, as previously suggested by Le Gal et al. (2017).
4.2 Chemistry of N-bearing species
Figure 5 also shows that N-bearing species display notably different column density distributions. While CH3CN shows a steep profile peaking near the PDR position, HC3N presents a more gradual increase toward the dense core. In contrast, HNCO exhibits similarities with the O-bearing molecules, as previously indicated by its integrated intensity distribution (see Fig. 3). In line with our interpretation for the O-bearing species, we propose that the chemistry of N-bearing molecules in FUV-irradiated regions is likewise influenced by atomic C chemistry.
According to the literature, CH3CN can be initiated in the gas phase through the radiative association reaction ![Mathematical equation: $\[\mathrm{CH}_{3}^{+}+\mathrm{HCN} \rightarrow \mathrm{CH}_{3} \mathrm{CNH}^{+}+h \nu\]$](/articles/aa/full_html/2026/03/aa57383-25/aa57383-25-eq15.png) , followed by dissociative recombination with electrons (Giani et al. 2023). Nevertheless, its enhanced column density near the PDR may indicate a contribution from dust grain surface chemistry, as previously suggested by Gratier et al. (2013) and supported by experimental evidence showing that CH3CN undergoes more efficient photodesorption than molecules such as CH3OH (Basalgète et al. 2021). One proposed grain-surface formation pathway involves the reaction between CH3 and CN radicals to form CH3CN (Garrod et al. 2008; Enrique-Romero & Lamberts 2025), with both radicals potentially originating from the diffusion of atomic C or the photodissociation of larger species.
, followed by dissociative recombination with electrons (Giani et al. 2023). Nevertheless, its enhanced column density near the PDR may indicate a contribution from dust grain surface chemistry, as previously suggested by Gratier et al. (2013) and supported by experimental evidence showing that CH3CN undergoes more efficient photodesorption than molecules such as CH3OH (Basalgète et al. 2021). One proposed grain-surface formation pathway involves the reaction between CH3 and CN radicals to form CH3CN (Garrod et al. 2008; Enrique-Romero & Lamberts 2025), with both radicals potentially originating from the diffusion of atomic C or the photodissociation of larger species.
Another possible route of CH3CN on grains is through the hydrogenation of C2N (Walsh et al. 2014). This molecule is thought to form primarily in the gas-phase via the reaction C2H + N → H + C2N, followed by freeze-out onto dust grains (Loomis et al. 2018). However, there are grain-surface reactions like C + CN or C2 + N → C2N listed as potential pathways in the Kinetic Database for Astrochemistry (KIDA; Wakelam et al. 2012, 2024) that have yet to be experimentally confirmed. Additionally, Canta et al. (2023) probed that the formation of CH3CN is also possible due to the photoprocessing of ice mixtures composed by NH3 and hydrocarbons of the form C2Hx, where the latter are possibly produced by atomic C on dust grains.
Despite the above, gas-phase chemistry may still play a significant role, as predicted by PDR models (Le Gal et al. 2019). CH3+, a key gas-phase precursor of CH3CN, can form efficiently in FUV-irradiated gas where C+ is abundant and vibrationally excited ![Mathematical equation: $\[\mathrm{H}_{2}^{*}~(v \geq 1)\]$](/articles/aa/full_html/2026/03/aa57383-25/aa57383-25-eq16.png) is present (Berné et al. 2023; Goicoechea et al. 2025), such as in PDRs (Zannese et al. 2025b). These same conditions also promote the efficient formation of HCO+ (Berné et al. 2024). Notably, all these requirements (
is present (Berné et al. 2023; Goicoechea et al. 2025), such as in PDRs (Zannese et al. 2025b). These same conditions also promote the efficient formation of HCO+ (Berné et al. 2024). Notably, all these requirements (![Mathematical equation: $\[\mathrm{C}^{+}, \mathrm{H}_{2}^{*}\]$](/articles/aa/full_html/2026/03/aa57383-25/aa57383-25-eq17.png) , and HCO+) are met in the Horsehead PDR, near the bright CH3CN filament (Bally et al. 2018; Hernández-Vera et al. 2023; Abergel et al. 2024). In contrast, in the FUV-shielded dense core, this mechanism is likely not relevant.
, and HCO+) are met in the Horsehead PDR, near the bright CH3CN filament (Bally et al. 2018; Hernández-Vera et al. 2023; Abergel et al. 2024). In contrast, in the FUV-shielded dense core, this mechanism is likely not relevant.
In the case of HC3N, it is generally accepted that this molecule lacks efficient grain-surface formation pathways (Bergner et al. 2017, 2018). This may account for the absence of a filamentary emission structure at the PDR, in contrast to most of the species discussed in this work, which likely receive significant contributions from dust grain chemistry. In the gas phase, the formation of HC3N is primarily driven by hydrocarbon reactions such as C2H2 + CN and C2H + HCN → HC3 N + H (Fukuzawa & Osamura 1997; Taniguchi et al. 2024). A less dominant, yet nonnegligible, route involves C3H2 + N → HC3N (Murillo et al. 2022). In the Horsehead nebula, these hydrocarbon precursors (e.g., C2H, C2H2, and C3H2) are believed to originate mainly from gas-phase reactions initiated by C+ and CH, along with PAH photochemistry (Guzmán et al. 2015). However, an alternative origin linked to products of grain-surface C chemistry, such as CH4 (Lamberts et al. 2022; Tsuge et al. 2024), may also contribute (e.g., Hassel et al. 2008; Sakai & Yamamoto 2013; Loison et al. 2017).
PdBI maps of C2H and c-C3H2 provide additional evidence that these species are chemically linked to HC3N. Guzmán et al. (2015) noted that the emission of these hydrocarbons follows the same two-filament structure recently revealed by high angular resolution observations of HCO+, located in the vicinity of the PDR and dense core (Hernández-Vera et al. 2023). At the PDR, HC3N does not display a noticeable filament, likely because it is more efficiently destroyed than formed – consistent with its rapid photodissociation relative to other N-bearing species such as CH3CN (Le Gal et al. 2019), as well as the lack of efficient grain-surface formation pathways. In contrast, within the filament near the dense core, all three molecules trace the same emitting region, although C2H appears to be depleted where c-C3H2 and HC3N are brighter. Moreover, at the exact position of the dense core – where HCO+ and DCO+ reach their emission peaks (Pety et al. 2007; Hernández-Vera et al. 2023) – HC3N shows a slight depletion, in line with its predicted rapid destruction via ion–molecule reactions (Taniguchi et al. 2024).
Lastly, although HNCO is composed by nitrogen and oxygen, we decided to consider it as a N-bearing molecule due to the key role of atomic N during its formation under FUV-irradiated conditions. Despite its relative simplicity, the formation pathways of HNCO remain poorly constrained. Current models suggest a combined contribution from both gas-phase and grain-surface chemistry, though disentangling their respective roles is challenging (Tideswell et al. 2010; Quan et al. 2010). In both cases, the radical NCO is considered a key intermediate (Marcelino et al. 2010). In the gas phase, HNCO can be formed via protonation of NCO by proton donors like ![Mathematical equation: $\[\mathrm{H}_{3}^{+}, \mathrm{H}_{3} \mathrm{O}^{+}\]$](/articles/aa/full_html/2026/03/aa57383-25/aa57383-25-eq18.png) , and HCO+, followed by further ion–molecule reactions and eventual dissociative recombination (Velilla Prieto et al. 2015; Cernicharo et al. 2024). On grain surfaces, hydrogenation of NCO has been proposed as an efficient alternative as well (Quan et al. 2010; Belloche et al. 2017).
, and HCO+, followed by further ion–molecule reactions and eventual dissociative recombination (Velilla Prieto et al. 2015; Cernicharo et al. 2024). On grain surfaces, hydrogenation of NCO has been proposed as an efficient alternative as well (Quan et al. 2010; Belloche et al. 2017).
However, the chemistry of NCO itself is also intricate. Its formation is typically modeled in the gas phase through reactions such as N + HCO → NCO + H (Quan et al. 2010; Cernicharo et al. 2024), CN + O2 → NCO + O (Marcelino et al. 2018; Cernicharo et al. 2024), and CN + OH → NCO + H (Velilla Prieto et al. 2015). Once produced, NCO may accrete onto dust grains (Quan et al. 2010), although direct formation on icy mantles is also possible via reactions between CO and atomic N (Fedoseev et al. 2015; Mignon et al. 2017), or through pathways involving CO photodissociation products such as O + CN and C + NO (Belloche et al. 2017). Notably, the latter reaction may benefit from efficient surface diffusion of atomic C.
Another important formation route for HNCO involves the simultaneous hydrogenation and UV processing of gas-phase NO after its accretion onto CO, H2CO, and CH3OH-rich ices (Fedoseev et al. 2016). This mechanism is particularly relevant given the abundant detection of NO at the edge of the Horsehead nebula (WHISPER collaboration, private communication). Laboratory experiments also suggest that the irradiation of ice mixtures containing other N-bearing species (e.g., N2, NH3, and HCN) may contribute to HNCO formation through complementary pathways (Jiménez-Escobar et al. 2014; Martín-Doménech et al. 2020, 2024). Such processes may help explain the elevated column densities observed near the PDR position. On the other hand, hydrogenation products of atomic N, such as NH and NH2, can efficiently react with CO on grain surfaces to form HNCO (Fedoseev et al. 2015; Belloche et al. 2017), in a manner analogous to the surface chemistry proposed for O-bearing species. This could account for the relatively high column densities of HNCO near the dense core, compared to other N-bearing molecules.
Similar to O-bearing species, these findings suggest that the chemistry of N-bearing molecules is closely linked to that of atomic C under FUV-irradiated conditions, both in the gas phase and on dust grain surfaces. Nonetheless, atomic N and its derivative species may also play a significant role, particularly in the case of HNCO, which contains fewer C atoms in its structure. To achieve a more comprehensive understanding of the formation and evolution of HNCO and N-bearing molecules in general, further dedicated studies targeting smaller N-bearing species (e.g., HCN, HNC, HNO, NCO, CN, and NO) in combination with detailed chemical modeling, are likely necessary.
Figure 6 presents a schematic overview of the physicochemical processes proposed in this work. Despite the experimental evidence and observational signposts that atomic C may contribute to the formation of COMs, modeling its surface chemistry remains challenging. A recent study by Lis et al. (2026), using the Meudon PDR code (Le Petit et al. 2006) wrapped in a locally circular 2D geometry, found difficulties in reproducing the observed water vapor emission in the Horsehead nebula, suggesting that current models may be missing key grain-surface or photochemical processes. This highlights the need for further refinement of surface chemistry treatments, which appear to be fundamental for accurately modeling the abundances of COMs.
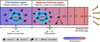 |
Fig. 6 Schematic summary of the proposed scenario at the edge of the Horsehead nebula. The two crosses indicate the PDR and dense core positions, as in Fig. 2. At the PDR, the moderate FUV field enables the coexistence of C and CO, together with a sufficiently high Tdust to allow efficient diffusion of atomic C on grain surfaces. These conditions may favor the formation of H2CO, CH2CO, CH3CHO, HNCO, and CH3CN, likely through a combination of gas-phase and grain-surface pathways. Interestingly, for the two species with the lowest PDR abundances, CH3OH and HC3N, previous studies suggested ineffective photodesorption and inefficient grain-surface formation, respectively. In the case of the dense core, the FUV-shielded conditions limit CO photodissociation, and the low Tdust makes the diffusion of atomic C on grains inefficient. These conditions may favor the grain-surface formation of H2CO and CH3OH, and also contribute to the prevalence of HC3N in the gas phase as it is less efficiently photodissociated. |
4.3 Implications in other UV-irradiated environments
The insights gained from the Horsehead nebula can inform our understanding of the formation of COMs in other UV-irradiated environments. Just as the Horsehead PDR serves as a benchmark for regions where molecular gas is exposed to moderate FUV radiation, the Orion Bar PDR has traditionally been regarded as a prototypical case for strongly FUV-irradiated molecular gas (Tielens et al. 1993; Hogerheijde et al. 1995; Goicoechea et al. 2016).
As a consequence of the higher FUV flux in the Orion Bar PDR (G0 > 104, Marconi et al. 1998; Peeters et al. 2024), the degree of photodissociation is expected to be significantly greater than in the Horsehead PDR. Furthermore, dust grains in the Orion Bar are warmer (Tdust ≃ 40–80 K, Arab et al. 2012), which inhibits the formation of substantial ice mantles and thereby reduces the efficiency of grain surface chemistry. We have found that most of the molecules analyzed in this work are less abundant in the gas phase of the Orion Bar PDR (Cuadrado et al. 2017) compared to the Horsehead PDR, with the remarkable exception of H2CO and CH3OH (see Table D.1).
Given that CH3OH is predominantly formed on grains – with H2CO as one of its main precursors – a nonnegligible grain-surface contribution deep inside the Orion Bar cannot be ruled out. Cuadrado et al. (2017) showed that pure gas-phase models fail to reproduce the observed abundances of H2CO and CH3OH, suggesting that the formation of organics on warm grains with limited ice mantles may still be feasible. Nevertheless, given the high abundance of C at the edge of the Orion Bar (Goicoechea et al. 2025) and the elevated dust temperatures, an efficient surface diffusion of atomic C on grains should play a significant role, but apparently is not the case. Hence, in contrast to the Horsehead PDR, where C can be sufficiently abundant on grains to compete with CO hydrogenation, the Orion Bar PDR appears to process ices dominated by CO rather than C, resembling those expected in the Horsehead dense core. This is, however, unlikely to occur in situ in the Bar owing to the high temperatures – though it may operate in dense cloud interiors, as evidenced by spatially resolved CH3OH observations (Leurini et al. 2010).
A possible explanation to these contrasting behaviors in surface chemistry products may lie in PDR dynamics. Cuadrado et al. (2017) already speculated that, in the Orion Bar, the advection of material from the cold, UV-shielded interior of the molecular cloud to the warmer PDR edge is plausible in the presence of considerable dynamical effects. Supporting this, Goicoechea et al. (2016) demonstrated that dynamical processes can significantly shape the cloud structure in the Orion Bar. In the case of the Horsehead, although dynamical effects are expected to be even stronger than in high-excitation PDRs (Maillard et al. 2021), the present results, together with the absence of photoablative molecular gas flows and the lower compression factors (Hernández-Vera et al. 2023), could suggest a less prominent dynamical influence compared to the Orion Bar, at least concerning COMs formation. Nevertheless, higher angular resolution observations are required to confidently assess this scenario.
Furthermore, a different ice composition affect not only grain-surface products but also the gas-phase processes. In the Orion Bar PDR, the intense UV radiation field likely results in nearly bare grains, depleted of H2O and especially CO (Goicoechea et al. 2025). This leads to an O-rich gas-phase environment at the PDR position, implying C/O < 1. Despite this, the higher gas temperatures and enhanced abundances of ![Mathematical equation: $\[\mathrm{H}_{2}^{*}, \mathrm{CH}^{+}, \mathrm{CH}_{3}^{+}\]$](/articles/aa/full_html/2026/03/aa57383-25/aa57383-25-eq19.png) , and other hydrocarbons drive an active hydrocarbon chemistry (Cuadrado et al. 2015; Goicoechea et al. 2025; Zannese et al. 2025b). Conversely, the lower dust temperatures in the Horsehead PDR allow for the formation of H2O ice – and to some extent CO ice – even within the UV-irradiated layers, favoring higher gas-phase C/O ratios (Le Gal et al. 2019). Considering the interplay between gas-phase and grain-surface chemistry previously discussed, these fundamental differences in ice and gas composition likely contribute to the observed variations in COM abundances.
, and other hydrocarbons drive an active hydrocarbon chemistry (Cuadrado et al. 2015; Goicoechea et al. 2025; Zannese et al. 2025b). Conversely, the lower dust temperatures in the Horsehead PDR allow for the formation of H2O ice – and to some extent CO ice – even within the UV-irradiated layers, favoring higher gas-phase C/O ratios (Le Gal et al. 2019). Considering the interplay between gas-phase and grain-surface chemistry previously discussed, these fundamental differences in ice and gas composition likely contribute to the observed variations in COM abundances.
Our spatially resolved analysis of complex organics in the Horsehead nebula can also have important implications for protoplanetary disks. Driven primarily by UV radiation and X-rays from the central star, the chemical composition observed in the cold outer regions of nearby disks qualitatively resembles that expected for classical PDRs (Öberg & Bergin 2021; Öberg et al. 2023). Rich in nitriles and hydrocarbons, yet notably deficient in large O-bearing organics, these disk regions are typically characterized by a high C/O ratio, a scenario similarly proposed for the Horsehead PDR. Furthermore, recent ALMA observations have uncovered extended [C I] emission in protoplanetary disks (Booth et al. 2023; Law et al. 2023; Urbina et al. 2024), possibly indicating that atomic C could have a relevant yet largely unexplored chemical role within these environments.
In this work, we find that CH3OH is not the dominant O-bearing species in the gas phase under moderate FUV irradiation, which may help explain its elusive detection in cold Class II disks (e.g., Carney et al. 2019; Loomis et al. 2020; Yamato et al. 2024). In contrast, H2CO is abundantly detected in disks (e.g., Pegues et al. 2020; Guzmán et al. 2021), yet its potential formation via grain-surface reactions involving atomic C remains unexplored. If efficient, this pathway would increase CH3OH production, whose photofragmentation might drive further chemical complexity, as observed in the Horsehead PDR. Similarly, N-bearing species like CH3CN and HC3N are also common in disks (Bergner et al. 2018; Ilee et al. 2021), with their formation likely tied to UV-driven chemistry (Calahan et al. 2023).
Although dust grains in protoplanetary disks typically settle toward the cold and UV-shielded midplane (Blum & Wurm 2008), turbulent mixing can transport icy material into more irradiated layers (Öberg et al. 2015; Bergner & Ciesla 2021; Ligterink et al. 2024). Models including this process predict notable effects for species like CH2CO, CH3CHO, and HNCO (Semenov & Wiebe 2011), which – despite their prebiotic relevance – are rarely targeted in disk studies. Recent observations by Yamato et al. (2024) also reveal abundant CH3OCH3 in the cold disk MWC 480 due to in situ ice processing. Altogether, these results suggest that PDR-like chemistry provides valuable context for disk studies, motivating the search for tracers beyond CH3OH.
5 Summary and conclusions
We have investigated the spatial distribution of simple and complex organic molecules at the FUV-irradiated edge of the Horsehead nebula. Using ALMA 7 m interferometry combined with IRAM 30 m single-dish data, we have mapped species such as C17O, HNCO, HC3N, CH3CN, CH2CO, and CH3CHO for the first time in this source, achieving an angular resolution of approximately ~15″. Our analysis also incorporates deep single-dish observations of C17O and C18O from the WHISPER survey, along with PdBI maps of H2CO and CH3OH from Guzmán et al. (2013). Integrated line intensity profiles were extracted along the direction of the FUV radiation, and radiative transfer modeling was used to constrain the gas physical conditions and molecular column densities. The main results and conclusions are summarized as follows:
The column density of C17O in the Horsehead nebula has been constrained for the first time. Using previous estimates of N(H2), an empirical C17O-to-H2 conversion factor of XC17O = N(H2)/N(C17O) ~ (5 ± 1) × 106 is obtained. The newly derived ratio N(C18O)/N(C17O) ~ 3.5 further confirms that this XC17O value is consistent with previous estimates from other CO isotopologues;
Application of the XC17O factor to the N(C17O) profiles yields empirical nH2 profiles, corroborating the presence of a steep density gradient at the edge of the Horsehead nebula, in agreement with prior models and observations;
Simultaneous fitting of multiple K-ladder transitions of CH3CN enabled the determination of empirical Tkin profiles, confirming previous temperature estimates at both the dense core and PDR positions obtained from various independent tracers.
From the nH2 and Tkin profiles, we derived an empirical profile of Pth. The high thermal pressure values, together with their relatively small variations across the distance from the FUV radiation source, confirm the compressed and isobaric nature of the Horsehead PDR;
Except for HC3N and CH3OH, most of the analyzed molecules – specifically H2CO, CH2CO, CH3CHO, HNCO, and CH3CN – show a clear increase in column density toward the PDR, suggesting that exposure to FUV irradiation favors their gas-phase abundance, contrary to classical PDR expectations. In the Horsehead, this likely points to a significant contribution from grain surface chemistry, given that HC3N is not efficiently formed on grains, while CH3OH, although formed on grains, is not efficiently desorbed;
Given that atomic C is expected to be abundant in PDRs due to CO photodissociation, and considering the widespread detection of O- and N-bearing COMs, the Horsehead nebula serves as a compelling example of how surface diffusion of atomic C on grains could enhance chemical complexity in the ISM, as recently suggested by laboratory experiments. Atomic C may contribute either by directly forming COMs on grain surfaces or by producing precursors that are subsequently desorbed, driving further chemical evolution in the gas phase.
Overall, compared to regions exposed to stronger FUV radiation fields, such as the Orion Bar, the Horsehead PDR appears to offer an optimal combination of temperature and UV intensity to promote the efficient formation of COMs through a complex interplay of gas-phase and grain-surface chemistry. Disentangling the relative contributions of these pathways will require higher angular resolution observations and/or James Webb Space Telescope (JWST) ice studies toward stars located behind the Horsehead. Our results further suggest that similar chemical processes may operate in other cold, UV-irradiated environments with abundant CO and H2O ices, such as the molecular layers of protoplanetary disks. However, additional chemical modeling and new observations will be essential to assess the broader applicability of these findings to other sources.
Acknowledgements
The authors thank the referee for the constructive comments that improved the content of this work. This paper makes use of the following ALMA data: ADS/JAO.ALMA#2016.2.00027.S. ALMA is a partnership of ESO (representing its member states), NSF (USA) and NINS (Japan), together with NRC (Canada), NSTC and ASIAA (Taiwan), and KASI (Republic of Korea), in cooperation with the Republic of Chile. The Joint ALMA Observatory is operated by ESO, AUI/NRAO and NAOJ. The National Radio Astronomy Observatory is a facility of the National Science Foundation operated under cooperative agreement by Associated Universities, Inc. Data reduction was carried out at the IRAM ARC node. C.H.-V. acknowledges support from the National Agency for Research and Development (ANID) – Scholarship Program through the Doctorado Nacional grant no. 2021-21212409. C.H.-V. and V.V.G. acknowledge support from the ANID – Millennium Science Initiative Program – Center Code NCN2024_001. V.V.G. also gratefully acknowledges support from FONDECYT Regular 1221352, and ANID CATA-BASAL project FB210003. J.P. and M.G. acknowledge support by the French Agence Nationale de la Recherche through the DAOISM grant ANR-21-CE31-0010 and by the Thematic Action “Physique et Chimie du Milieu Interstellaire” (PCMI) of INSU Programme National “Astro”, with contributions from CNRS Physique & CNRS Chimie, CEA, and CNES. K.T.W. acknowledges support from the European Research Council (ERC) under the European Union’s Horizon 2020 research and innovation programme (Grant agreement no. 883867, project EXWINGS). J.R.G. thanks the Spanish MCINN for funding support under grant PID2023-146667NB-I00.
References
- Abergel, A., Teyssier, D., Bernard, J. P., et al. 2003, A&A, 410, 577 [CrossRef] [EDP Sciences] [Google Scholar]
- Abergel, A., Misselt, K., Gordon, K. D., et al. 2024, A&A, 687, A4 [NASA ADS] [CrossRef] [EDP Sciences] [Google Scholar]
- Altwegg, K., Balsiger, H., Bar-Nun, A., et al. 2016, Sci. Adv., 2, e1600285 [NASA ADS] [CrossRef] [Google Scholar]
- Anthony-Twarog, B. J. 1982, AJ, 87, 1213 [NASA ADS] [CrossRef] [Google Scholar]
- Arab, H., Abergel, A., Habart, E., et al. 2012, A&A, 541, A19 [NASA ADS] [CrossRef] [EDP Sciences] [Google Scholar]
- Bacmann, A., Taquet, V., Faure, A., Kahane, C., & Ceccarelli, C. 2012, A&A, 541, L12 [NASA ADS] [CrossRef] [EDP Sciences] [Google Scholar]
- Bally, J., Chambers, E., Guzman, V., et al. 2018, AJ, 155, 80 [Google Scholar]
- Basalgète, R., Ocaña, A. J., Féraud, G., et al. 2021, ApJ, 922, 213 [CrossRef] [Google Scholar]
- Belloche, A., Meshcheryakov, A. A., Garrod, R. T., et al. 2017, A&A, 601, A49 [NASA ADS] [CrossRef] [EDP Sciences] [Google Scholar]
- Belloche, A., Maury, A. J., Maret, S., et al. 2020, A&A, 635, A198 [NASA ADS] [CrossRef] [EDP Sciences] [Google Scholar]
- Ben Khalifa, M., Dagdigian, P. J., & Loreau, J. 2023, MNRAS, 523, 2577 [NASA ADS] [CrossRef] [Google Scholar]
- Bergner, J. B., & Ciesla, F. 2021, ApJ, 919, 45 [NASA ADS] [CrossRef] [Google Scholar]
- Bergner, J. B., Öberg, K. I., Garrod, R. T., & Graninger, D. M. 2017, ApJ, 841, 120 [Google Scholar]
- Bergner, J. B., Guzmán, V. G., Öberg, K. I., Loomis, R. A., & Pegues, J. 2018, ApJ, 857, 69 [Google Scholar]
- Berné, O., Martin-Drumel, M.-A., Schroetter, I., et al. 2023, Nature, 621, 56 [CrossRef] [Google Scholar]
- Berné, O., Habart, E., Peeters, E., et al. 2024, Science, 383, 988 [Google Scholar]
- Bertin, M., Romanzin, C., Doronin, M., et al. 2016, ApJ, 817, L12 [NASA ADS] [CrossRef] [Google Scholar]
- Bisschop, S. E., Jørgensen, J. K., van Dishoeck, E. F., & de Wachter, E. B. M. 2007, A&A, 465, 913 [NASA ADS] [CrossRef] [EDP Sciences] [Google Scholar]
- Blum, J., & Wurm, G. 2008, ARA&A, 46, 21 [CrossRef] [Google Scholar]
- Bolatto, A. D., Wolfire, M., & Leroy, A. K. 2013, ARA&A, 51, 207 [Google Scholar]
- Bonfand, M., Belloche, A., Menten, K. M., Garrod, R. T., & Müller, H. S. P. 2017, A&A, 604, A60 [NASA ADS] [CrossRef] [EDP Sciences] [Google Scholar]
- Booth, A. S., Law, C. J., Temmink, M., Leemker, M., & Macías, E. 2023, A&A, 678, A146 [NASA ADS] [CrossRef] [EDP Sciences] [Google Scholar]
- Borshcheva, K., Fedoseev, G., Punanova, A. F., et al. 2025, ApJ, 990, 163 [Google Scholar]
- Bron, E., Agúndez, M., Goicoechea, J. R., & Cernicharo, J. 2018, arXiv e-prints [arXiv:1801.01547] [Google Scholar]
- Calahan, J. K., Bergin, E. A., Bosman, A. D., et al. 2023, Nat. Astron., 7, 49 [Google Scholar]
- Canta, A., Öberg, K. I., & Rajappan, M. 2023, ApJ, 953, 81 [NASA ADS] [CrossRef] [Google Scholar]
- Carilli, C. L., & Walter, F. 2013, ARA&A, 51, 105 [Google Scholar]
- Carney, M. T., Hogerheijde, M. R., Guzmán, V. V., et al. 2019, A&A, 623, A124 [NASA ADS] [CrossRef] [EDP Sciences] [Google Scholar]
- CASA Team (Bean, B., et al.) 2022, PASP, 134, 114501 [NASA ADS] [CrossRef] [Google Scholar]
- Cazaux, S., Tielens, A. G. G. M., Ceccarelli, C., et al. 2003, ApJ, 593, L51 [CrossRef] [Google Scholar]
- Ceccarelli, C., Codella, C., Balucani, N., et al. 2023, in Astronomical Society of the Pacific Conference Series, 534, Protostars and Planets VII, eds. S. Inutsuka, Y. Aikawa, T. Muto, K. Tomida, & M. Tamura, 379 [Google Scholar]
- Cernicharo, J., Marcelino, N., Roueff, E., et al. 2012, ApJ, 759, L43 [NASA ADS] [CrossRef] [Google Scholar]
- Cernicharo, J., Agúndez, M., Cabezas, C., et al. 2024, A&A, 682, L4 [NASA ADS] [CrossRef] [EDP Sciences] [Google Scholar]
- Chen, Y., Garrod, R. T., Rachid, M., et al. 2025, A&A, 696, A198 [NASA ADS] [CrossRef] [EDP Sciences] [Google Scholar]
- Chuang, K. J., Fedoseev, G., Qasim, D., et al. 2020, A&A, 635, A199 [NASA ADS] [CrossRef] [EDP Sciences] [Google Scholar]
- Clark, I. Y., Sandstrom, K., Wolfire, M., et al. 2025, ApJ, 990, 209 [Google Scholar]
- Cortes, P. C., Carpenter, J., Kameno, S., et al. 2025, https://doi.org/10.5281/zenodo.14933753 [Google Scholar]
- Cuadrado, S., Goicoechea, J. R., Pilleri, P., et al. 2015, A&A, 575, A82 [NASA ADS] [CrossRef] [EDP Sciences] [Google Scholar]
- Cuadrado, S., Goicoechea, J. R., Cernicharo, J., et al. 2017, A&A, 603, A124 [NASA ADS] [CrossRef] [EDP Sciences] [Google Scholar]
- de Marcellus, P., Meinert, C., Myrgorodska, I., et al. 2015, PNAS, 112, 965 [NASA ADS] [CrossRef] [Google Scholar]
- Draine, B. T. 1978, ApJS, 36, 595 [Google Scholar]
- Duflot, D., Toubin, C., & Monnerville, M. 2021, Front. Astron. Space Sci., 8, 24 [NASA ADS] [CrossRef] [Google Scholar]
- Endres, C. P., Schlemmer, S., Schilke, P., Stutzki, J., & Müller, H. S. P. 2016, J. Mol. Spectrosc., 327, 95 [NASA ADS] [CrossRef] [Google Scholar]
- Enrique-Romero, J., & Lamberts, T. 2025, A&A, 699, A235 [NASA ADS] [CrossRef] [EDP Sciences] [Google Scholar]
- Evans, L., Booth, A. S., Walsh, C., et al. 2025, ApJ, 982, 62 [Google Scholar]
- Faure, A., Lique, F., & Wiesenfeld, L. 2016, MNRAS, 460, 2103 [NASA ADS] [CrossRef] [Google Scholar]
- Fedoseev, G., Ioppolo, S., Zhao, D., Lamberts, T., & Linnartz, H. 2015, MNRAS, 446, 439 [NASA ADS] [CrossRef] [Google Scholar]
- Fedoseev, G., Chuang, K. J., van Dishoeck, E. F., Ioppolo, S., & Linnartz, H. 2016, MNRAS, 460, 4297 [Google Scholar]
- Fedoseev, G., Qasim, D., Chuang, K.-J., et al. 2022, ApJ, 924, 110 [NASA ADS] [CrossRef] [Google Scholar]
- Feng, S., Beuther, H., Henning, T., et al. 2015, A&A, 581, A71 [NASA ADS] [CrossRef] [EDP Sciences] [Google Scholar]
- Ferrero, S., Ceccarelli, C., Ugliengo, P., Sodupe, M., & Rimola, A. 2024, ApJ, 960, 22 [NASA ADS] [CrossRef] [Google Scholar]
- Foreman-Mackey, D., Hogg, D. W., Lang, D., & Goodman, J. 2013, PASP, 125, 306 [Google Scholar]
- Fuchs, G. W., Cuppen, H. M., Ioppolo, S., et al. 2009, A&A, 505, 629 [NASA ADS] [CrossRef] [EDP Sciences] [Google Scholar]
- Fukuzawa, K., & Osamura, Y. 1997, ApJ, 489, 113 [Google Scholar]
- Garrod, R. T. 2013, ApJ, 765, 60 [Google Scholar]
- Garrod, R. T., Wakelam, V., & Herbst, E. 2007, A&A, 467, 1103 [NASA ADS] [CrossRef] [EDP Sciences] [Google Scholar]
- Garrod, R. T., Widicus Weaver, S. L., & Herbst, E. 2008, ApJ, 682, 283 [Google Scholar]
- Garrod, R. T., Jin, M., Matis, K. A., et al. 2022, ApJS, 259, 1 [NASA ADS] [CrossRef] [Google Scholar]
- Gerin, M., Goicoechea, J. R., Pety, J., & Hily-Blant, P. 2009, A&A, 494, 977 [NASA ADS] [CrossRef] [EDP Sciences] [Google Scholar]
- Gerin, M., Liszt, H., Tercero, B., & Cernicharo, J. 2025, A&A, 703, A125 [NASA ADS] [CrossRef] [EDP Sciences] [Google Scholar]
- Giani, L., Ceccarelli, C., Mancini, L., et al. 2023, MNRAS, 526, 4535 [NASA ADS] [CrossRef] [Google Scholar]
- Goicoechea, J. R., Pety, J., Gerin, M., et al. 2006, A&A, 456, 565 [NASA ADS] [CrossRef] [EDP Sciences] [Google Scholar]
- Goicoechea, J. R., Compiègne, M., & Habart, E. 2009a, ApJ, 699, L165 [Google Scholar]
- Goicoechea, J. R., Pety, J., Gerin, M., Hily-Blant, P., & Le Bourlot, J. 2009b, A&A, 498, 771 [NASA ADS] [CrossRef] [EDP Sciences] [Google Scholar]
- Goicoechea, J. R., Pety, J., Cuadrado, S., et al. 2016, Nature, 537, 207 [Google Scholar]
- Goicoechea, J. R., Pety, J., Cuadrado, S., et al. 2025, A&A, 696, A100 [NASA ADS] [CrossRef] [EDP Sciences] [Google Scholar]
- Goldsmith, P. F., & Langer, W. D. 1999, ApJ, 517, 209 [Google Scholar]
- Gratier, P., Pety, J., Guzmán, V., et al. 2013, A&A, 557, A101 [CrossRef] [EDP Sciences] [Google Scholar]
- Green, S. 1986, ApJ, 309, 331 [NASA ADS] [CrossRef] [Google Scholar]
- Guesten, R., Walmsley, C. M., Ungerechts, H., & Churchwell, E. 1985, A&A, 142, 381 [NASA ADS] [Google Scholar]
- Guzmán, V., Pety, J., Gratier, P., et al. 2012, A&A, 543, L1 [CrossRef] [EDP Sciences] [Google Scholar]
- Guzmán, V. V., Goicoechea, J. R., Pety, J., et al. 2013, A&A, 560, A73 [Google Scholar]
- Guzmán, V. V., Pety, J., Gratier, P., et al. 2014, Faraday Discuss., 168, 103 [Google Scholar]
- Guzmán, V. V., Pety, J., Goicoechea, J. R., et al. 2015, ApJ, 800, L33 [CrossRef] [Google Scholar]
- Guzmán, V. V., Bergner, J. B., Law, C. J., et al. 2021, ApJS, 257, 6 [CrossRef] [Google Scholar]
- Habart, E., Abergel, A., Walmsley, C. M., Teyssier, D., & Pety, J. 2005, A&A, 437, 177 [NASA ADS] [CrossRef] [EDP Sciences] [Google Scholar]
- Hasegawa, T. I., & Herbst, E. 1993, MNRAS, 261, 83 [NASA ADS] [CrossRef] [Google Scholar]
- Hassel, G. E., Herbst, E., & Garrod, R. T. 2008, ApJ, 681, 1385 [Google Scholar]
- Heays, A. N., Bosman, A. D., & van Dishoeck, E. F. 2017, A&A, 602, A105 [NASA ADS] [CrossRef] [EDP Sciences] [Google Scholar]
- Herbst, E., & van Dishoeck, E. F. 2009, ARA&A, 47, 427 [Google Scholar]
- Hernández-Vera, C., Guzmán, V. V., Goicoechea, J. R., et al. 2023, A&A, 677, A152 [NASA ADS] [CrossRef] [EDP Sciences] [Google Scholar]
- Hernández-Vera, C., Guzmán, V. V., Artur de la Villarmois, E., et al. 2024, ApJ, 967, 68 [CrossRef] [Google Scholar]
- Hogerheijde, M. R., Jansen, D. J., & van Dishoeck, E. F. 1995, A&A, 294, 792 [NASA ADS] [Google Scholar]
- Holdship, J., Viti, S., Martín, S., et al. 2021, A&A, 654, A55 [NASA ADS] [CrossRef] [EDP Sciences] [Google Scholar]
- Hollenbach, D. J., & Tielens, A. G. G. M. 1999, Rev. Mod. Phys., 71, 173 [Google Scholar]
- Hollenbach, D., Kaufman, M. J., Bergin, E. A., & Melnick, G. J. 2009, ApJ, 690, 1497 [NASA ADS] [CrossRef] [Google Scholar]
- Ilee, J. D., Walsh, C., Booth, A. S., et al. 2021, ApJS, 257, 9 [NASA ADS] [CrossRef] [Google Scholar]
- Jiménez-Escobar, A., Giuliano, B. M., Muñoz Caro, G. M., Cernicharo, J., & Marcelino, N. 2014, ApJ, 788, 19 [CrossRef] [Google Scholar]
- Jiménez-Serra, I., Vasyunin, A. I., Caselli, P., et al. 2016, ApJ, 830, L6 [Google Scholar]
- Jiménez-Serra, I., Martín-Pintado, J., Rivilla, V. M., et al. 2020, Astrobiology, 20, 1048 [Google Scholar]
- Jin, M., & Garrod, R. T. 2020, ApJS, 249, 26 [Google Scholar]
- Joblin, C., Bron, E., Pinto, C., et al. 2018, A&A, 615, A129 [NASA ADS] [CrossRef] [EDP Sciences] [Google Scholar]
- Jørgensen, J. K., Belloche, A., & Garrod, R. T. 2020, ARA&A, 58, 727 [Google Scholar]
- Kobayashi, H., Hidaka, H., Lamberts, T., et al. 2017, ApJ, 837, 155 [Google Scholar]
- Lamberts, T., Fedoseev, G., van Hemert, M. C., et al. 2022, ApJ, 928, 48 [NASA ADS] [CrossRef] [Google Scholar]
- Law, C. J., Alarcón, F., Cleeves, L. I., Öberg, K. I., & Paneque-Carreño, T. 2023, ApJ, 959, L27 [NASA ADS] [CrossRef] [Google Scholar]
- Le Gal, R., Herbst, E., Dufour, G., et al. 2017, A&A, 605, A88 [NASA ADS] [CrossRef] [EDP Sciences] [Google Scholar]
- Le Gal, R., Brady, M. T., Öberg, K. I., Roueff, E., & Le Petit, F. 2019, ApJ, 886, 86 [NASA ADS] [CrossRef] [Google Scholar]
- Le Petit, F., Nehmé, C., Le Bourlot, J., & Roueff, E. 2006, ApJS, 164, 506 [NASA ADS] [CrossRef] [Google Scholar]
- Leurini, S., Parise, B., Schilke, P., Pety, J., & Rolffs, R. 2010, A&A, 511, A82 [NASA ADS] [CrossRef] [EDP Sciences] [Google Scholar]
- Ligterink, N. F. W., Pinilla, P., van der Marel, N., et al. 2024, Nat. Astron., 8, 1257 [Google Scholar]
- Lis, D. C., Maillard, V., Bron, E., et al. 2026, A&A, 706, A7 [NASA ADS] [CrossRef] [EDP Sciences] [Google Scholar]
- Loison, J.-C., Agúndez, M., Wakelam, V., et al. 2017, MNRAS, 470, 4075 [Google Scholar]
- Loomis, R. A., Cleeves, L. I., Öberg, K. I., et al. 2018, ApJ, 859, 131 [Google Scholar]
- Loomis, R. A., Öberg, K. I., Andrews, S. M., et al. 2020, ApJ, 893, 101 [Google Scholar]
- López-Sepulcre, A., Codella, C., Ceccarelli, C., Podio, L., & Robuschi, J. 2024, A&A, 692, A120 [NASA ADS] [CrossRef] [EDP Sciences] [Google Scholar]
- Maillard, V., Bron, E., & Le Petit, F. 2021, A&A, 656, A65 [NASA ADS] [CrossRef] [EDP Sciences] [Google Scholar]
- Maity, S., Kaiser, R. I., & Jones, B. M. 2014, ApJ, 789, 36 [Google Scholar]
- Marcelino, N., Brünken, S., Cernicharo, J., et al. 2010, A&A, 516, A105 [NASA ADS] [CrossRef] [EDP Sciences] [Google Scholar]
- Marcelino, N., Agúndez, M., Cernicharo, J., Roueff, E., & Tafalla, M. 2018, A&A, 612, L10 [NASA ADS] [CrossRef] [EDP Sciences] [Google Scholar]
- Marconi, A., Testi, L., Natta, A., & Walmsley, C. M. 1998, A&A, 330, 696 [NASA ADS] [Google Scholar]
- Martín-Doménech, R., Maksiutenko, P., Öberg, K. I., & Rajappan, M. 2020, ApJ, 902, 116 [Google Scholar]
- Martín-Doménech, R., DelFranco, A., Öberg, K. I., & Rajappan, M. 2024, ApJ, 962, 107 [Google Scholar]
- McMullin, J. P., Waters, B., Schiebel, D., Young, W., & Golap, K. 2007, in Astronomical Society of the Pacific Conference Series, 376, Astronomical Data Analysis Software and Systems XVI, eds. R. A. Shaw, F. Hill, & D. J. Bell, 127 [Google Scholar]
- Mignon, P., Allouche, A.-R., & Bacchus-Montabonel, M.-C. 2017, Chem. Phys., 488, 28 [Google Scholar]
- Minissale, M., Aikawa, Y., Bergin, E., et al. 2022, ACS Earth Space Chem., 6, 597 [NASA ADS] [CrossRef] [Google Scholar]
- Molpeceres, G., Kästner, J., Fedoseev, G., et al. 2021, J. Phys. Chem. Lett., 12, 10854 [CrossRef] [Google Scholar]
- Murillo, N. M., van Dishoeck, E. F., Hacar, A., Harsono, D., & Jørgensen, J. K. 2022, A&A, 658, A53 [NASA ADS] [CrossRef] [EDP Sciences] [Google Scholar]
- Oba, Y., Takano, Y., Naraoka, H., Watanabe, N., & Kouchi, A. 2019, Nat. Commun., 10, 4413 [NASA ADS] [CrossRef] [Google Scholar]
- Öberg, K. I. 2016, Chem. Rev., 116, 9631 [Google Scholar]
- Öberg, K. I., & Bergin, E. A. 2021, Phys. Rep., 893, 1 [Google Scholar]
- Öberg, K. I., Garrod, R. T., van Dishoeck, E. F., & Linnartz, H. 2009, A&A, 504, 891 [NASA ADS] [CrossRef] [EDP Sciences] [Google Scholar]
- Öberg, K. I., Lauck, T., & Graninger, D. 2014, ApJ, 788, 68 [Google Scholar]
- Öberg, K. I., Guzmán, V. V., Furuya, K., et al. 2015, Nature, 520, 198 [Google Scholar]
- Öberg, K. I., Facchini, S., & Anderson, D. E. 2023, ARA&A, 61, 287 [Google Scholar]
- Peeters, E., Habart, E., Berné, O., et al. 2024, A&A, 685, A74 [NASA ADS] [CrossRef] [EDP Sciences] [Google Scholar]
- Pegues, J., Öberg, K. I., Bergner, J. B., et al. 2020, ApJ, 890, 142 [Google Scholar]
- Petry, D., Vila-Vilaro, B., Villard, E., Komugi, S., & Schnee, S. 2014, SPIE Conf. Ser., 9152, 91520J [Google Scholar]
- Pety, J., Teyssier, D., Fossé, D., et al. 2005, A&A, 435, 885 [NASA ADS] [CrossRef] [EDP Sciences] [Google Scholar]
- Pety, J., Goicoechea, J. R., Hily-Blant, P., Gerin, M., & Teyssier, D. 2007, A&A, 464, L41 [NASA ADS] [CrossRef] [EDP Sciences] [Google Scholar]
- Pety, J., Gratier, P., Guzmán, V., et al. 2012, A&A, 548, A68 [NASA ADS] [CrossRef] [EDP Sciences] [Google Scholar]
- Philipp, S. D., Lis, D. C., Güsten, R., et al. 2006, A&A, 454, 213 [NASA ADS] [CrossRef] [EDP Sciences] [Google Scholar]
- Pickett, H. M., Poynter, R. L., Cohen, E. A., et al. 1998, J. Quant. Spec. Radiat. Transf., 60, 883 [Google Scholar]
- Potapov, A., & Garrod, R. T. 2024, A&A, 692, A252 [NASA ADS] [CrossRef] [EDP Sciences] [Google Scholar]
- Potapov, A., Krasnokutski, S. A., Jäger, C., & Henning, T. 2021, ApJ, 920, 111 [CrossRef] [Google Scholar]
- Pound, M. W., Reipurth, B., & Bally, J. 2003, AJ, 125, 2108 [NASA ADS] [CrossRef] [Google Scholar]
- Qasim, D., Fedoseev, G., Chuang, K. J., et al. 2020, Nat. Astron., 4, 781 [Google Scholar]
- Quan, D., Herbst, E., Osamura, Y., & Roueff, E. 2010, ApJ, 725, 2101 [NASA ADS] [CrossRef] [Google Scholar]
- Rabli, D., & Flower, D. R. 2010, MNRAS, 406, 95 [Google Scholar]
- Ramal-Olmedo, J. C., Menor-Salván, C. A., & Fortenberry, R. C. 2021, A&A, 656, A148 [NASA ADS] [CrossRef] [EDP Sciences] [Google Scholar]
- Rivilla, V. M., Martín-Pintado, J., Jiménez-Serra, I., et al. 2019, MNRAS, 483, L114 [NASA ADS] [CrossRef] [Google Scholar]
- Rivilla, V. M., Sanz-Novo, M., Jiménez-Serra, I., et al. 2023, ApJ, 953, L20 [NASA ADS] [CrossRef] [Google Scholar]
- Rodriguez-Fernandez, N., Pety, J., & Gueth, F. 2008, Single-dish observation and processing to produce the short-spacing information for a millimeter interferometer, Tech. rep., IRAM, Grenoble [Google Scholar]
- Roueff, A., Gerin, M., Gratier, P., et al. 2021, A&A, 645, A26 [NASA ADS] [CrossRef] [EDP Sciences] [Google Scholar]
- Roueff, A., Pety, J., Gerin, M., et al. 2024, A&A, 686, A255 [NASA ADS] [CrossRef] [EDP Sciences] [Google Scholar]
- Ruiterkamp, R., Charnley, S. B., Butner, H. M., et al. 2007, Ap&SS, 310, 181 [Google Scholar]
- Sahnoun, E., Wiesenfeld, L., Hammami, K., & Jaidane, N. 2018, J. Phys. Chem. A, 122, 3004 [NASA ADS] [CrossRef] [Google Scholar]
- Sakai, N., & Yamamoto, S. 2013, Chem. Rev., 113, 8981 [Google Scholar]
- Schirmer, T., Abergel, A., Verstraete, L., et al. 2020, A&A, 639, A144 [NASA ADS] [CrossRef] [EDP Sciences] [Google Scholar]
- Schöier, F. L., van der Tak, F. F. S., van Dishoeck, E. F., & Black, J. H. 2005, A&A, 432, 369 [Google Scholar]
- Scibelli, S., Shirley, Y., Megías, A., & Jiménez-Serra, I. 2024, MNRAS, 533, 4104 [Google Scholar]
- Ségal, L., Roueff, A., Pety, J., et al. 2024, A&A, 692, A160 [NASA ADS] [CrossRef] [EDP Sciences] [Google Scholar]
- Semenov, D., & Wiebe, D. 2011, ApJS, 196, 25 [Google Scholar]
- Shannon, R. J., Blitz, M. A., Goddard, A., & Heard, D. E. 2013, Nat. Chem., 5, 745 [CrossRef] [Google Scholar]
- Shimonishi, T., Nakatani, N., Furuya, K., & Hama, T. 2018, ApJ, 855, 27 [Google Scholar]
- Taniguchi, K., Gorai, P., & Tan, J. C. 2024, Ap&SS, 369, 34 [NASA ADS] [CrossRef] [Google Scholar]
- Tideswell, D. M., Fuller, G. A., Millar, T. J., & Markwick, A. J. 2010, A&A, 510, A85 [NASA ADS] [CrossRef] [EDP Sciences] [Google Scholar]
- Tielens, A. G. G. M., Meixner, M. M., van der Werf, P. P., et al. 1993, Science, 262, 86 [NASA ADS] [CrossRef] [Google Scholar]
- Tsuge, M., Molpeceres, G., Aikawa, Y., & Watanabe, N. 2023, Nat. Astron., 7, 1351 [NASA ADS] [CrossRef] [Google Scholar]
- Tsuge, M., Molpeceres, G., Aikawa, Y., & Watanabe, N. 2024, ApJ, 973, 80 [NASA ADS] [CrossRef] [Google Scholar]
- Urbina, F., Miley, J., Kama, M., & Keyte, L. 2024, A&A, 686, A120 [NASA ADS] [CrossRef] [EDP Sciences] [Google Scholar]
- van der Tak, F. F. S., Black, J. H., Schöier, F. L., Jansen, D. J., & van Dishoeck, E. F. 2007, A&A, 468, 627 [NASA ADS] [CrossRef] [EDP Sciences] [Google Scholar]
- van der Walt, S. J., Kristensen, L. E., Jørgensen, J. K., et al. 2021, A&A, 655, A86 [NASA ADS] [CrossRef] [EDP Sciences] [Google Scholar]
- Vazart, F., Ceccarelli, C., Balucani, N., Bianchi, E., & Skouteris, D. 2020, MNRAS, 499, 5547 [Google Scholar]
- Velilla Prieto, L., Sánchez Contreras, C., Cernicharo, J., et al. 2015, A&A, 575, A84 [CrossRef] [EDP Sciences] [Google Scholar]
- Wakelam, V., Herbst, E., Loison, J. C., et al. 2012, ApJS, 199, 21 [Google Scholar]
- Wakelam, V., Gratier, P., Loison, J. C., et al. 2024, A&A, 689, A63 [NASA ADS] [CrossRef] [EDP Sciences] [Google Scholar]
- Walsh, C., Millar, T. J., Nomura, H., et al. 2014, A&A, 563, A33 [NASA ADS] [CrossRef] [EDP Sciences] [Google Scholar]
- Walsh, C., Loomis, R. A., Öberg, K. I., et al. 2016, ApJ, 823, L10 [NASA ADS] [CrossRef] [Google Scholar]
- Warren, Jr., W. H., & Hesser, J. E. 1977, ApJS, 34, 115 [NASA ADS] [CrossRef] [Google Scholar]
- Watanabe, N., & Kouchi, A. 2002, ApJ, 571, L173 [Google Scholar]
- Wiesenfeld, L., & Faure, A. 2013, MNRAS, 432, 2573 [NASA ADS] [CrossRef] [Google Scholar]
- Wilson, T. L., & Rood, R. 1994, ARA&A, 32, 191 [Google Scholar]
- Wolfire, M. G., Vallini, L., & Chevance, M. 2022, ARA&A, 60, 247 [Google Scholar]
- Wu, R., Bron, E., Onaka, T., et al. 2018, A&A, 618, A53 [NASA ADS] [CrossRef] [EDP Sciences] [Google Scholar]
- Yamato, Y., Aikawa, Y., Guzmán, V. V., et al. 2024, ApJ, 974, 83 [Google Scholar]
- Yang, B., Stancil, P. C., Balakrishnan, N., & Forrey, R. C. 2010, ApJ, 718, 1062 [Google Scholar]
- Yang, Y.-L., Sakai, N., Zhang, Y., et al. 2021, ApJ, 910, 20 [Google Scholar]
- Yocum, K. M., Milam, S. N., Gerakines, P. A., & Widicus Weaver, S. L. 2021, ApJ, 913, 61 [NASA ADS] [CrossRef] [Google Scholar]
- Zannese, M., Guillard, P., Abergel, A., et al. 2025a, A&A, 704, A202 [NASA ADS] [CrossRef] [EDP Sciences] [Google Scholar]
- Zannese, M., Tabone, B., Habart, E., et al. 2025b, A&A, 696, A99 [NASA ADS] [CrossRef] [EDP Sciences] [Google Scholar]
The PDR is located at ![Mathematical equation: $\[\alpha_{2000}=05^{\mathrm{h}} 40^{\mathrm{m}} 53^{\mathrm{s}}_\cdot936, \delta_{2000}=-02^{\circ} 28^{\prime} 00^{\prime \prime}\]$](/articles/aa/full_html/2026/03/aa57383-25/aa57383-25-eq40.png) and the dense core is located at
and the dense core is located at ![Mathematical equation: $\[\alpha_{2000}=05^{\mathrm{h}} 40^{\mathrm{m}} 55^{\mathrm{s}}_\cdot 61, \delta_{2000}= -02^{\circ} 27^{\prime} 38^{\prime \prime}\]$](/articles/aa/full_html/2026/03/aa57383-25/aa57383-25-eq41.png) .
.
This is now referred to as the differential gain calibrator and is observed with the DIFFGAIN scan intent in recent cycles.
We neglect the possible influence of H, He, and e− as collisional partners.
In Hernández-Vera et al. (2023) the factor of 2 in the definition of nH ~ 2nH2 is missing. As a result, and for consistency with previous work, the range of values used for comparison here is Pth = (4.6–8.0) × 106 K cm−3.
Appendix A Observational details
Table A.1 summarizes the observational details of the spectral setup used in the ALMA 7 m observations.
Spectral setup of the ALMA 7 m observations
Appendix B Bayesian fitting results
B.1 WHISPER CO isotopologues observations
Figure B.1 presents the best-fit models accounting for the hyperfine structure of the C17O (top panels) and C18O (bottom panels) J = 1–0 and 2 − 1 rotational transitions, based on the WHISPER data analysis described in Sect. 3.2.1. The best-fit parameters and their statistical uncertainties for the PDR and dense core positions are shown in the middle of each panel. Averaging the results for the PDR and dense core yields Tex(C17O) ~ 15 K and N(C18O)/N(C17O) ~ 3.6, which are the values adopted in Sect. 3.2.1 for the posterior analysis of the ALMA 7 m+30 m combined dataset.
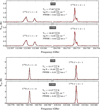 |
Fig. B.1 C17O (top panels) and C18O (bottom panels) spectra at the PDR position ( |
![Mathematical equation: $\[\delta x \approx 15^{\prime \prime}_\cdot 1, \delta y \approx 1^{\prime \prime}_\cdot2\]$](/articles/aa/full_html/2026/03/aa57383-25/aa57383-25-eq20.png)
![Mathematical equation: $\[\delta x \approx 44^{\prime \prime}_\cdot7, \delta y \approx 16^{\prime \prime}_\cdot5\]$](/articles/aa/full_html/2026/03/aa57383-25/aa57383-25-eq21.png)
B.2 ALMA 7 m+30 m C17O observations
Figure B.2 presents zeroth-moment maps of the hyperfine components of the C17O J = 1–0 rotational transition from the combined ALMA 7 m+30 m dataset. Only two maps are displayed, as the two hyperfine components at 112.359 GHz are blended (see Table C.1). The green and cyan squares mark the PDR and dense core positions, respectively, where the spectra were extracted for the calibration of the C17O-to-H2 conversion factor.
Below the maps, the corresponding spectra and best-fit models are displayed, with the derived parameters and their associated uncertainties indicated, following a similar format as in Fig. B.1. By assuming Tex (C17O) = 15 K, we derive column densities of N(C17O) = (4.7 ± 0.2) × 1015 cm−2 for the PDR and N(C17O) = (5.2 ± 0.2) × 1015 cm−2 for the dense core. These values are slightly higher than those obtained with WHISPER, likely due to beam dilution. As a sensitivity test, we repeated the fitting procedure using the Tex values estimated from WHISPER at both positions (see Fig. B.1), finding no substantial changes in the derived N(C17O) or FWHM values.
These results, together with N(H2) estimates from Guzmán et al. (2014), were used to calibrate the C17O-to-H2 conversion factor discussed in Sect. 3.2.1. Equivalent plots were generated (but are not shown) for the remaining δx positions at the heights of the PDR (![Mathematical equation: $\[\delta y \sim 1^{\prime \prime}_\cdot 2\]$](/articles/aa/full_html/2026/03/aa57383-25/aa57383-25-eq22.png) ) and dense core (
) and dense core (![Mathematical equation: $\[\delta y \sim 16^{\prime\prime}_\cdot 5\]$](/articles/aa/full_html/2026/03/aa57383-25/aa57383-25-eq23.png) ), enabling the computation of the nH2 profiles as described in Sect. 3.2.2.
), enabling the computation of the nH2 profiles as described in Sect. 3.2.2.
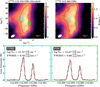 |
Fig. B.2 Top row: ALMA 7 m+30 m zeroth-moment maps of the hyperfine components of the C17O J = 1–0 rotational transition resolved at the Horsehead edge. The rotation angle and red vertical line are the same as in Fig. 2. The contours are [5, 10, 20, 30, 50, 100] × σ, where σ is the zeroth-moment rms listed in Table 1. The dense core and PDR positions are marked with cyan and green squares, respectively, indicating the regions where the spectra were extracted. The beam size and a scale bar indicating 4000 au are shown in the bottom left and bottom right corner, respectively, of each panel. Bottom row: C17O spectra extracted at the dense core and PDR positions, shown using matching colors to the map markers. The best-fit models are overlaid in red. The best-fit excitation conditions and associated uncertainties, presented in the top left corner of each panel, correspond to the 16th, 50th, and 84th percentiles of the posterior distributions. |
B.3 ALMA 7 m+30 m CH3CN observations
Figure B.3 presents the best-fit models to the integrated intensity profiles of the various CH3CN J = 6 − 5 (K = 0, 1, and 2) transitions, extracted at the vertical positions of the dense core (left panel) and the PDR (right panel), following the procedure described in Sect. 3.2.3. Near the PDR (δx < 30″), the K = 0, 1, and 2 transitions were jointly fit. However, toward the dense core (δx ≥ 30″), the integrated intensity of the K = 2 transition was used only as an upper limit due to observed line profile asymmetries and broader line widths relative to the other K-ladder transitions. As the K = 2 line corresponds to the highest Eu among the analyzed CH3CN transitions (see Table C.1), we speculate that its emission does not originate in the cold dense core, but rather arises from warmer gas along the line of sight, a phenomenon previously reported in the Horsehead for tracers such as CS and HCO (Goicoechea et al. 2006; Gerin et al. 2009). It is also plausible that this warmer, more diffuse component has different kinematics compared to the quiescent dense core, which could explain not only the line broadening but also the asymmetric deviations from a purely Gaussian line profile.
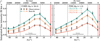 |
Fig. B.3 Integrated intensity profiles of the CH3CN J = 6 − 5 (K = 0, 1, and 2) transitions at the δy positions of the dense core (left panel) and the PDR (right panel), as obtained from the ALMA 7 m+30 m observations. Each color corresponds to a different K-ladder transition, as indicated by the labels in the right panel. The observed data points are shown as circles, and the best-fit models are overlaid as solid lines in the corresponding colors. The red vertical line, the dotted vertical lines, and the horizontal gray bar are the same as in the left panels of Fig. 3. |
Appendix C Molecular data
Table C.1 summarizes the spectroscopic constants and the critical densities for all the molecular lines analyzed throughout this work.
Molecular data of the transitions analyzed in this work.
Appendix D Abundances at the PDR and dense core positions
Figure D.1 presents the column density profiles derived at the vertical position of the dense core, analogous to those shown for the vertical position of the PDR in Sect. 3.2.5. For comparison with the Orion Bar PDR, we extracted the column density values specifically at the δx positions of the dense core (![Mathematical equation: $\[\delta x \approx 44^{\prime \prime}_\cdot7\]$](/articles/aa/full_html/2026/03/aa57383-25/aa57383-25-eq24.png) , from Fig. D.1) and the PDR (
, from Fig. D.1) and the PDR (![Mathematical equation: $\[\delta x \approx 15^{\prime \prime}_\cdot1\]$](/articles/aa/full_html/2026/03/aa57383-25/aa57383-25-eq25.png) , from Fig. 5) to estimate their abundances with respect to total hydrogen nuclei. The resulting values, together with those for the Orion Bar reported in the literature, are listed in Table D.1.
, from Fig. 5) to estimate their abundances with respect to total hydrogen nuclei. The resulting values, together with those for the Orion Bar reported in the literature, are listed in Table D.1.
Abundances with respect to total hydrogen nuclei (N(X)/NH, in units of 10−10).
All Tables
All Figures
|
Fig. 1 Composite image of the field of view mapped in the Horsehead nebula (Barnard 33). Left: horsehead nebula and adjacent H II region IC 434 imaged by Euclid Early Release Observations (ESA/Euclid/Euclid Consortium/NASA). Right: zoomed-in image of the edge of the Horsehead nebula imaged with data combined from the ALMA 7 m and the IRAM 30 m telescopes. The emission of different N-bearing molecules are represented: CH3CN (JK = 60–50, in green) and HC3N (J = 11–10, in blue). The emission from hot ionized gas is also shown, traced by the Hα line (in red) observed with the 0.9 m KPNO telescope (Pound et al. 2003). The average beam size of the ALMA 7 m+30 m observations and a physical scale reference are shown in the bottom left and bottom right corner, respectively. |
| In the text | |
|
Fig. 2 Zeroth-moment maps gallery for different molecular species moderately resolved at the Horsehead edge. The maps have been rotated 14° counterclockwise to bring the illuminating star direction in the horizontal direction. The contours are [3, 5, 10, 15, 20, 25, 30] × σ, where σ is the zeroth-moment rms listed in Table 1. The red vertical line represents the horizontal zero, delineating the PDR edge (Pety et al. 2005), whereas the cyan and green crosses show the dense core (Pety et al. 2007) and PDR (Gerin et al. 2009) positions, respectively. The beam size and a scale bar indicating 4000 au are shown in the bottom left and bottom right corner, respectively, of each panel. Transitions corresponding to the same molecular species are shown using the same color-scale range. |
| In the text | |
|
Fig. 3 Left column: integrated line intensity profiles along the direction of the exciting star extracted from the maps shown in Fig. 2 and the convolved maps obtained from Guzmán et al. (2013). For molecules with more than one transition, the brightest is displayed. The profiles were extracted at the δy position of the PDR (top panel) and dense core (bottom panel), and averaged over 10″ in the δy direction. The dotted vertical lines represent the δx position of the PDR and dense core, and the vertical red line represents the PDR edge. The average beam size is represented by the horizontal gray bar. The colored area of each profile displays the ±σ significance levels, taking into account the standard deviation of the average and the zeroth-moment rms. Right column: regions used to extract the profiles, indicated by white rectangles overlaid on the HNCO zeroth-moment map. The two crosses, the red vertical line, and the contours are the same as in Fig. 2. |
| In the text | |
|
Fig. 4 Empirical gas density (top panel), kinetic temperature (middle panel), and thermal pressure (bottom panel) profiles determined from C17O and CH3CN observations of the Horsehead edge, extracted at the δy position of the PDR (blue circles) and dense core (orange circles). The beam sizes of the respective molecular tracers from which the values were derived are represented by the horizontal gray bar in the top left corner of each panel. The red vertical line and the dotted vertical lines are the same as in the left panels of Fig. 3. For comparison, the gas density profile modeled by Habart et al. (2005) convolved with a Gaussian of 15″ FWHM (green line) and the thermal pressure range from Hernández-Vera et al. (2023) (purple-shaded region) are also shown. |
| In the text | |
|
Fig. 5 Column density profiles derived at the δy position of the PDR from the radiative transfer modeling of the O-bearing (left panel) and N-bearing (right panel) molecules analyzed in this work. For each color the solid line depicts the best-fit values, whose uncertainties are represented by the shaded areas of the same color. The red vertical line, the dotted vertical lines, and the horizontal gray bar are the same as in the left panels of Fig. 3. The same profiles, but at the δy position of the dense core, are shown in Fig. D.1. |
| In the text | |
|
Fig. 6 Schematic summary of the proposed scenario at the edge of the Horsehead nebula. The two crosses indicate the PDR and dense core positions, as in Fig. 2. At the PDR, the moderate FUV field enables the coexistence of C and CO, together with a sufficiently high Tdust to allow efficient diffusion of atomic C on grain surfaces. These conditions may favor the formation of H2CO, CH2CO, CH3CHO, HNCO, and CH3CN, likely through a combination of gas-phase and grain-surface pathways. Interestingly, for the two species with the lowest PDR abundances, CH3OH and HC3N, previous studies suggested ineffective photodesorption and inefficient grain-surface formation, respectively. In the case of the dense core, the FUV-shielded conditions limit CO photodissociation, and the low Tdust makes the diffusion of atomic C on grains inefficient. These conditions may favor the grain-surface formation of H2CO and CH3OH, and also contribute to the prevalence of HC3N in the gas phase as it is less efficiently photodissociated. |
| In the text | |
|
Fig. B.1 C17O (top panels) and C18O (bottom panels) spectra at the PDR position ( |
| In the text | |
|
Fig. B.2 Top row: ALMA 7 m+30 m zeroth-moment maps of the hyperfine components of the C17O J = 1–0 rotational transition resolved at the Horsehead edge. The rotation angle and red vertical line are the same as in Fig. 2. The contours are [5, 10, 20, 30, 50, 100] × σ, where σ is the zeroth-moment rms listed in Table 1. The dense core and PDR positions are marked with cyan and green squares, respectively, indicating the regions where the spectra were extracted. The beam size and a scale bar indicating 4000 au are shown in the bottom left and bottom right corner, respectively, of each panel. Bottom row: C17O spectra extracted at the dense core and PDR positions, shown using matching colors to the map markers. The best-fit models are overlaid in red. The best-fit excitation conditions and associated uncertainties, presented in the top left corner of each panel, correspond to the 16th, 50th, and 84th percentiles of the posterior distributions. |
| In the text | |
|
Fig. B.3 Integrated intensity profiles of the CH3CN J = 6 − 5 (K = 0, 1, and 2) transitions at the δy positions of the dense core (left panel) and the PDR (right panel), as obtained from the ALMA 7 m+30 m observations. Each color corresponds to a different K-ladder transition, as indicated by the labels in the right panel. The observed data points are shown as circles, and the best-fit models are overlaid as solid lines in the corresponding colors. The red vertical line, the dotted vertical lines, and the horizontal gray bar are the same as in the left panels of Fig. 3. |
| In the text | |
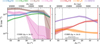 |
Fig. D.1 Same as Fig. 5, but at the δy position of the dense core. |
| In the text | |
Current usage metrics show cumulative count of Article Views (full-text article views including HTML views, PDF and ePub downloads, according to the available data) and Abstracts Views on Vision4Press platform.
Data correspond to usage on the plateform after 2015. The current usage metrics is available 48-96 hours after online publication and is updated daily on week days.
Initial download of the metrics may take a while.