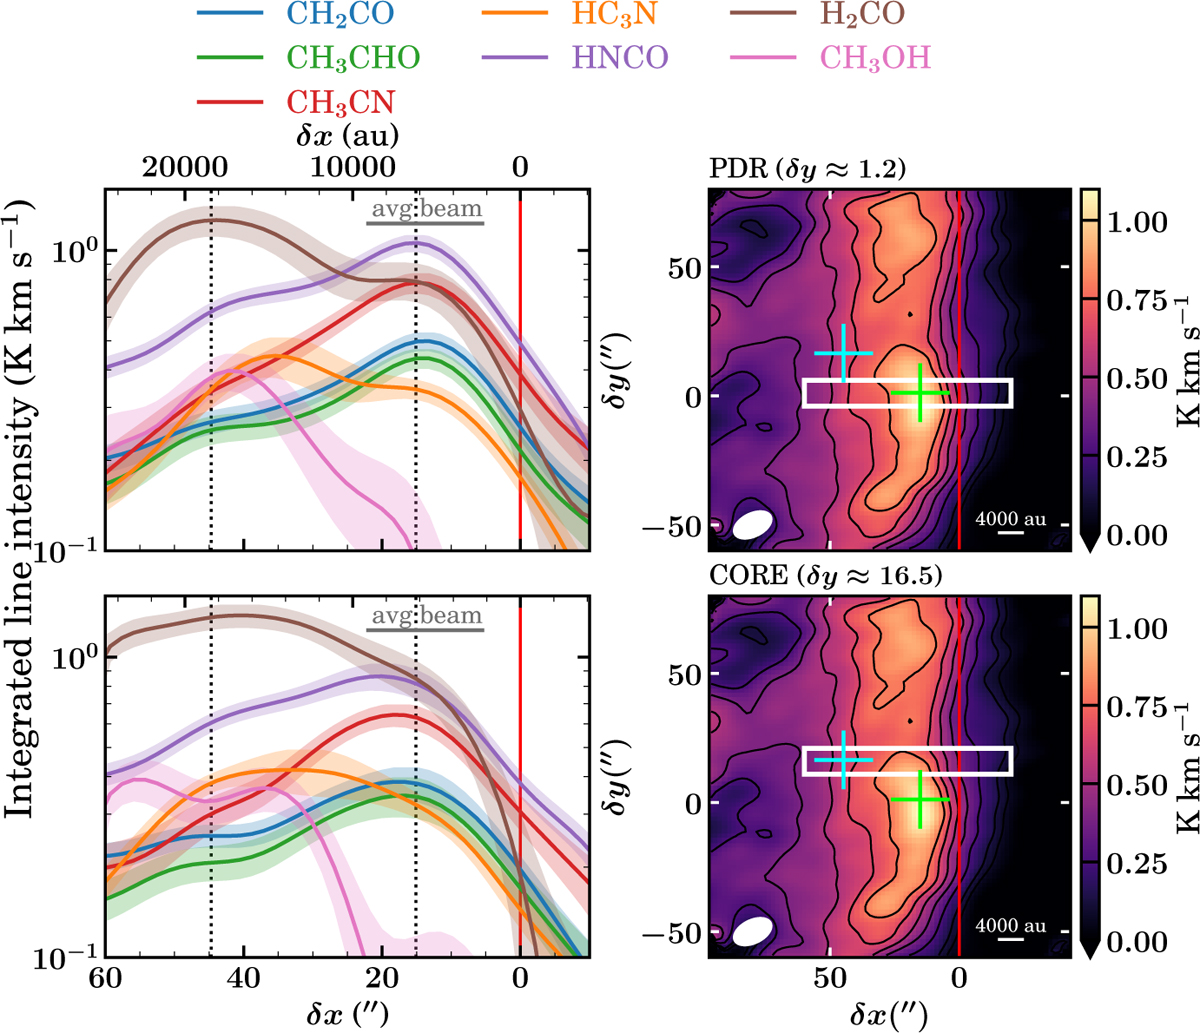
Fig. 3
Download original image
Left column: integrated line intensity profiles along the direction of the exciting star extracted from the maps shown in Fig. 2 and the convolved maps obtained from Guzmán et al. (2013). For molecules with more than one transition, the brightest is displayed. The profiles were extracted at the δy position of the PDR (top panel) and dense core (bottom panel), and averaged over 10″ in the δy direction. The dotted vertical lines represent the δx position of the PDR and dense core, and the vertical red line represents the PDR edge. The average beam size is represented by the horizontal gray bar. The colored area of each profile displays the ±σ significance levels, taking into account the standard deviation of the average and the zeroth-moment rms. Right column: regions used to extract the profiles, indicated by white rectangles overlaid on the HNCO zeroth-moment map. The two crosses, the red vertical line, and the contours are the same as in Fig. 2.
Current usage metrics show cumulative count of Article Views (full-text article views including HTML views, PDF and ePub downloads, according to the available data) and Abstracts Views on Vision4Press platform.
Data correspond to usage on the plateform after 2015. The current usage metrics is available 48-96 hours after online publication and is updated daily on week days.
Initial download of the metrics may take a while.