Fig. 4
Download original image
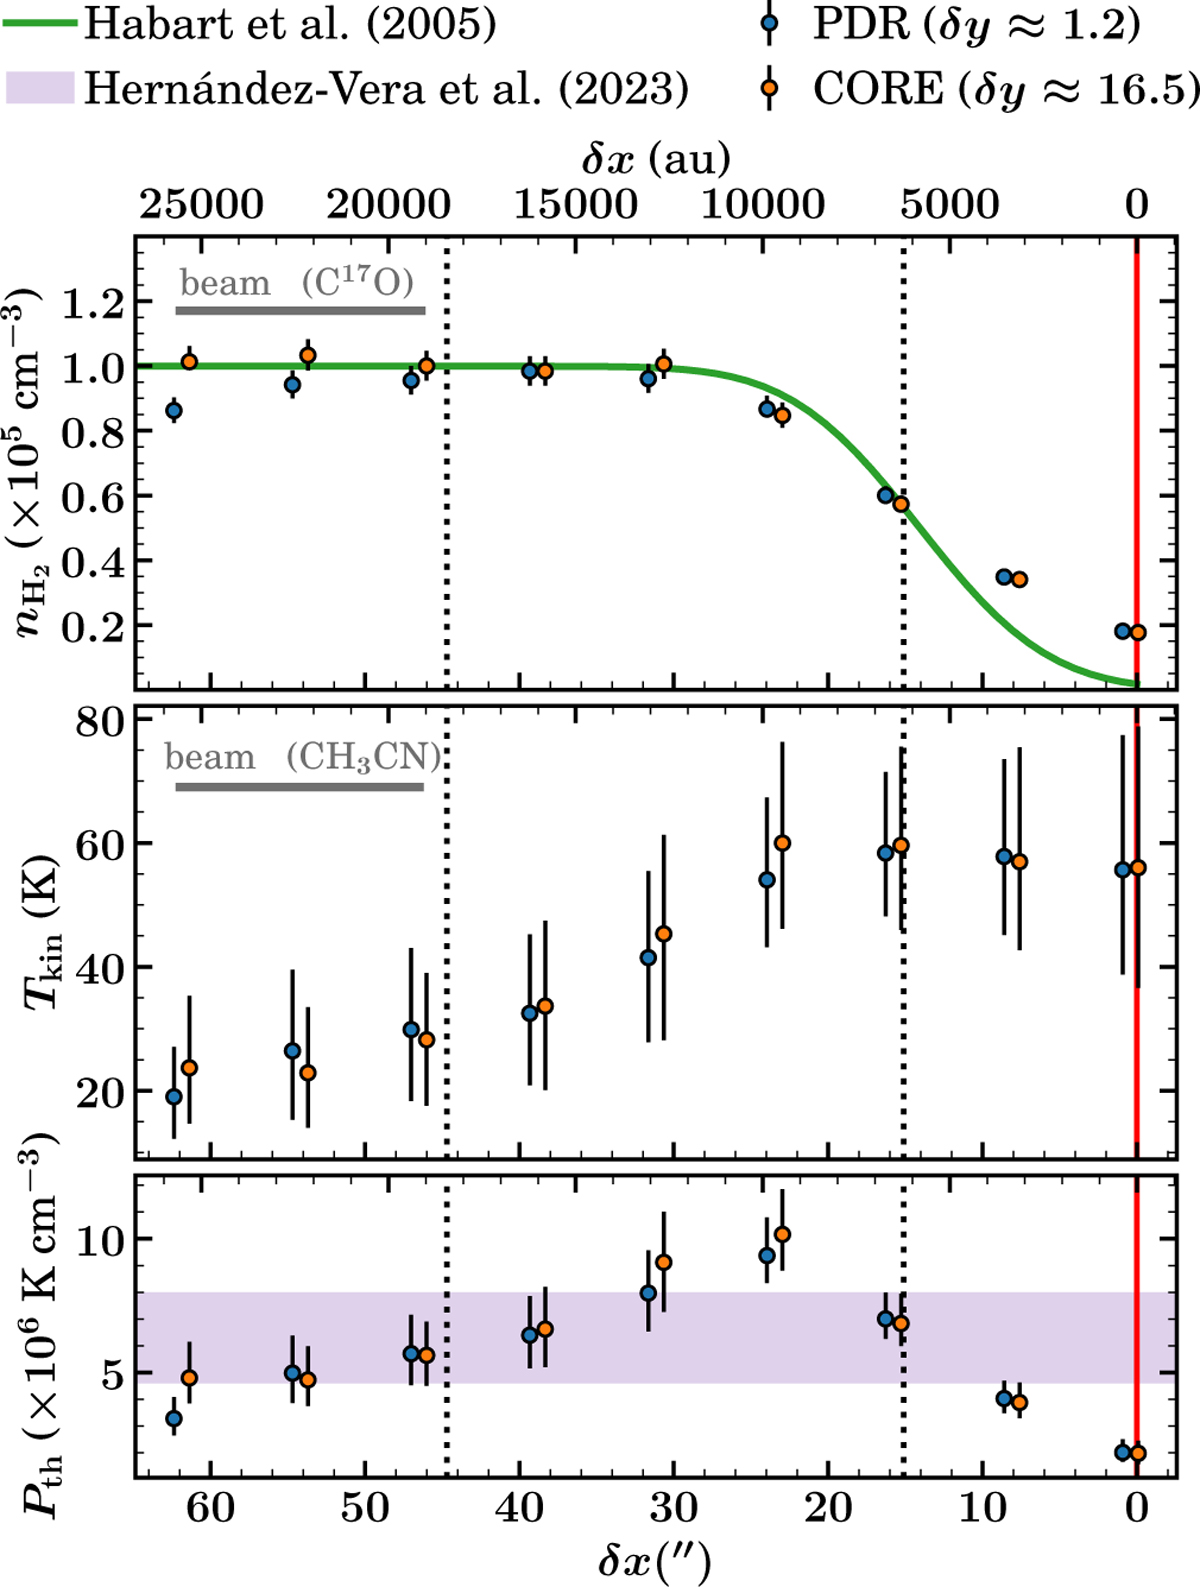
Empirical gas density (top panel), kinetic temperature (middle panel), and thermal pressure (bottom panel) profiles determined from C17O and CH3CN observations of the Horsehead edge, extracted at the δy position of the PDR (blue circles) and dense core (orange circles). The beam sizes of the respective molecular tracers from which the values were derived are represented by the horizontal gray bar in the top left corner of each panel. The red vertical line and the dotted vertical lines are the same as in the left panels of Fig. 3. For comparison, the gas density profile modeled by Habart et al. (2005) convolved with a Gaussian of 15″ FWHM (green line) and the thermal pressure range from Hernández-Vera et al. (2023) (purple-shaded region) are also shown.
Current usage metrics show cumulative count of Article Views (full-text article views including HTML views, PDF and ePub downloads, according to the available data) and Abstracts Views on Vision4Press platform.
Data correspond to usage on the plateform after 2015. The current usage metrics is available 48-96 hours after online publication and is updated daily on week days.
Initial download of the metrics may take a while.