Fig. 5
Download original image
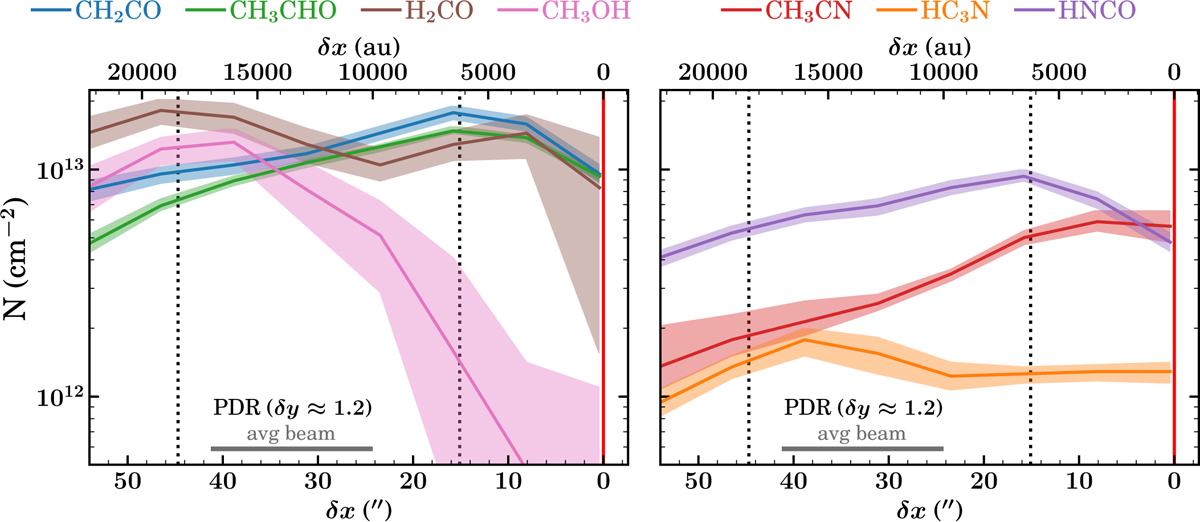
Column density profiles derived at the δy position of the PDR from the radiative transfer modeling of the O-bearing (left panel) and N-bearing (right panel) molecules analyzed in this work. For each color the solid line depicts the best-fit values, whose uncertainties are represented by the shaded areas of the same color. The red vertical line, the dotted vertical lines, and the horizontal gray bar are the same as in the left panels of Fig. 3. The same profiles, but at the δy position of the dense core, are shown in Fig. D.1.
Current usage metrics show cumulative count of Article Views (full-text article views including HTML views, PDF and ePub downloads, according to the available data) and Abstracts Views on Vision4Press platform.
Data correspond to usage on the plateform after 2015. The current usage metrics is available 48-96 hours after online publication and is updated daily on week days.
Initial download of the metrics may take a while.