Fig. B.1
Download original image
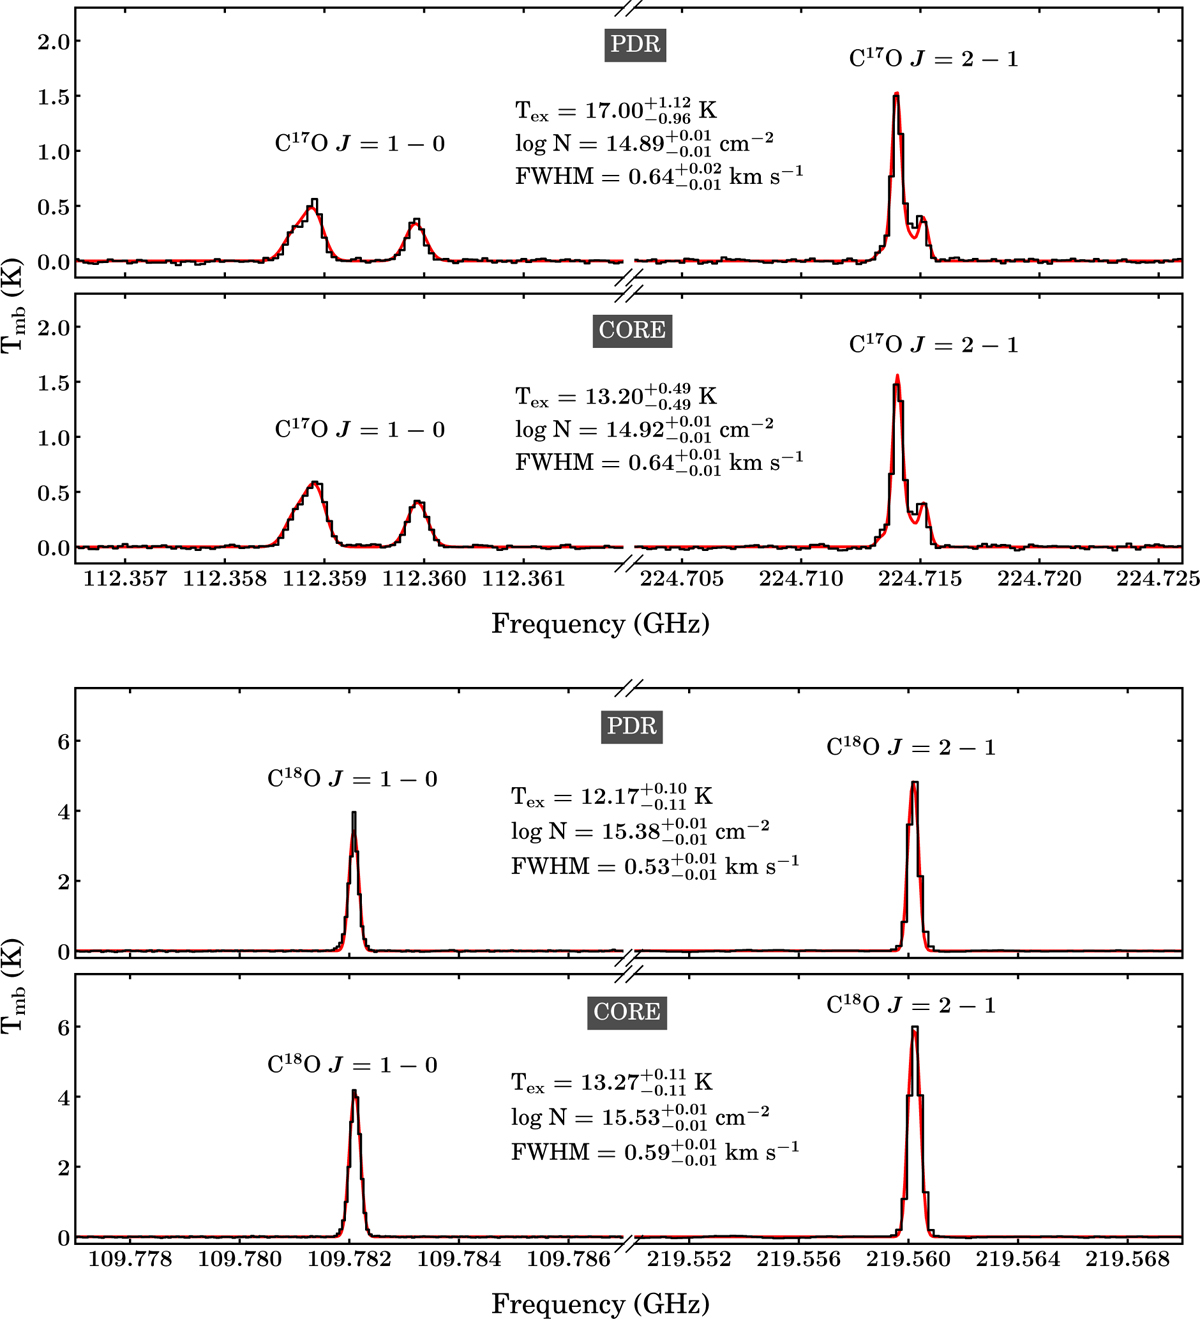
C17O (top panels) and C18O (bottom panels) spectra at the PDR position (![]() ) and dense core position (
) and dense core position (![]() ), as observed in the Horsehead WHISPER survey. The best-fit models are overlaid in red. The best-fit excitation conditions and associated uncertainties, shown in the middle of each panel, correspond to the 16th, 50th, and 84th percentiles of the posterior distributions.
), as observed in the Horsehead WHISPER survey. The best-fit models are overlaid in red. The best-fit excitation conditions and associated uncertainties, shown in the middle of each panel, correspond to the 16th, 50th, and 84th percentiles of the posterior distributions.
Current usage metrics show cumulative count of Article Views (full-text article views including HTML views, PDF and ePub downloads, according to the available data) and Abstracts Views on Vision4Press platform.
Data correspond to usage on the plateform after 2015. The current usage metrics is available 48-96 hours after online publication and is updated daily on week days.
Initial download of the metrics may take a while.